CHUV with Oracle
Note
The following documentation about implementation is provided by Le Centre hospitalier universitaire vaudois (CHUV). For additional information or questions, please send an email to SPHN Data Coordination Center at dcc@sib.swiss.
Introduction
The CHUV RDF Graph Solution mainly resides on Oracle Database 12 and Ontop Graph System 4.
A Jenkins pipeline creates and deploys the RDF graphs.
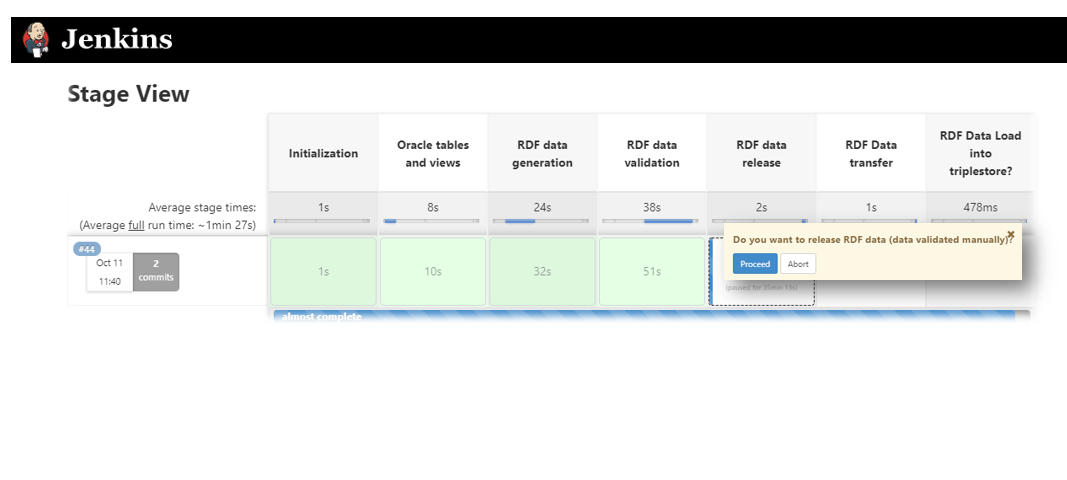
Graph Life Cycle
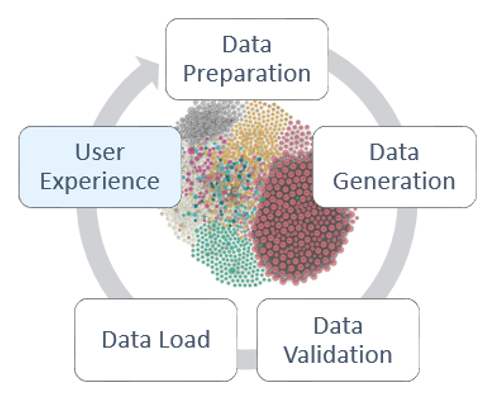
The pipeline encompasses the following steps :
Data Preparation
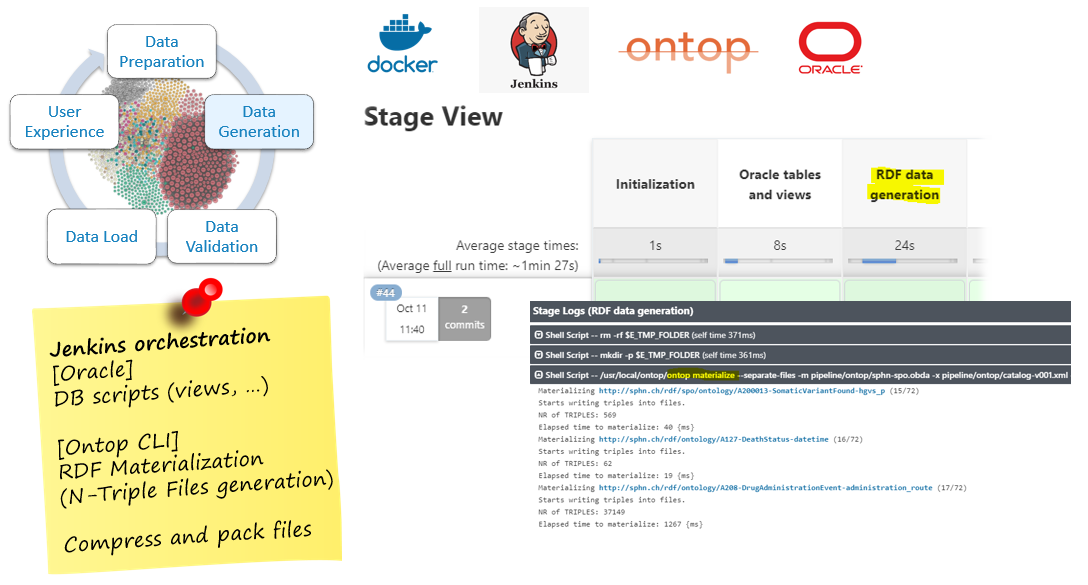
Data Generation
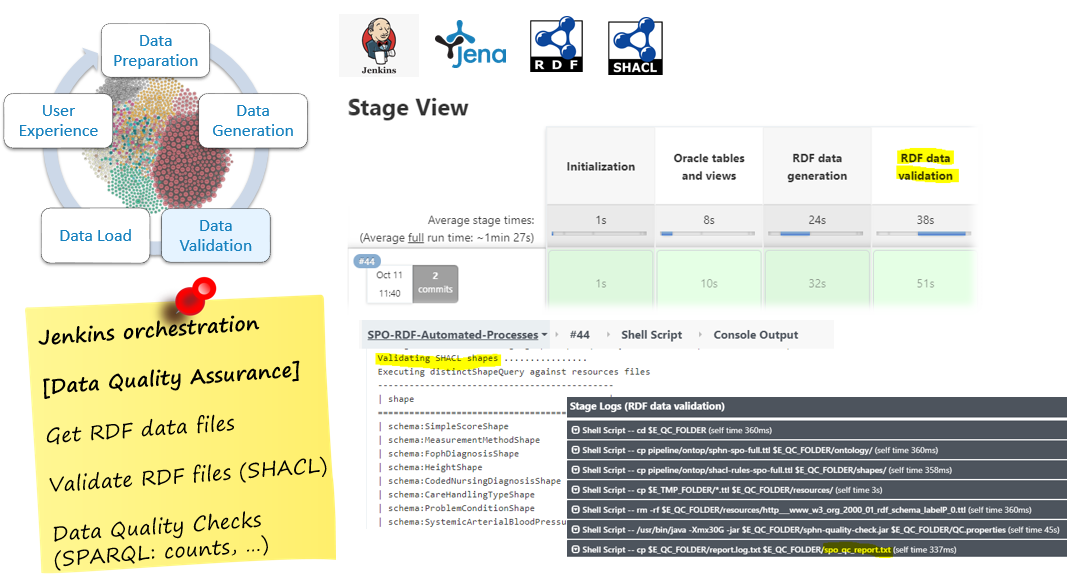
Data Validation
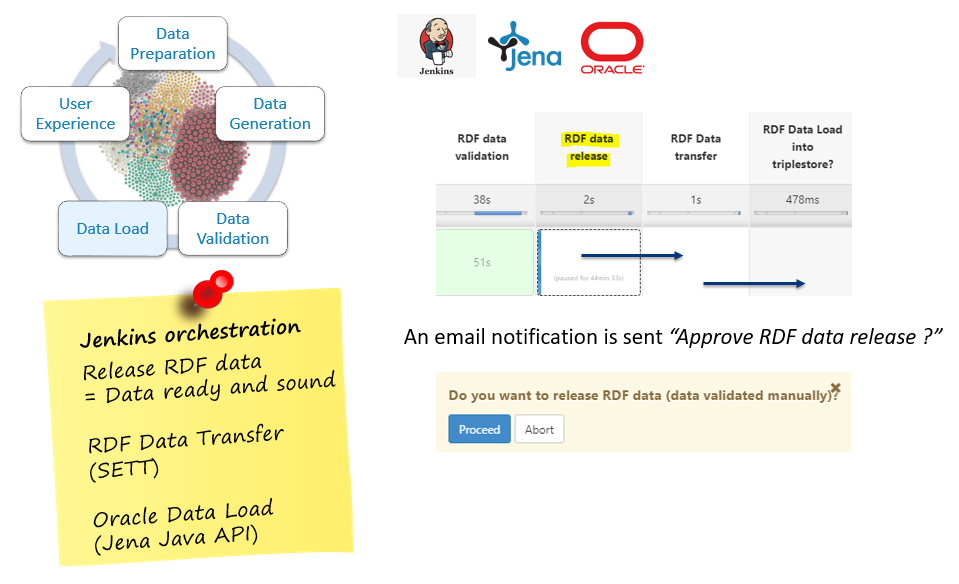
Data Transfer & Load
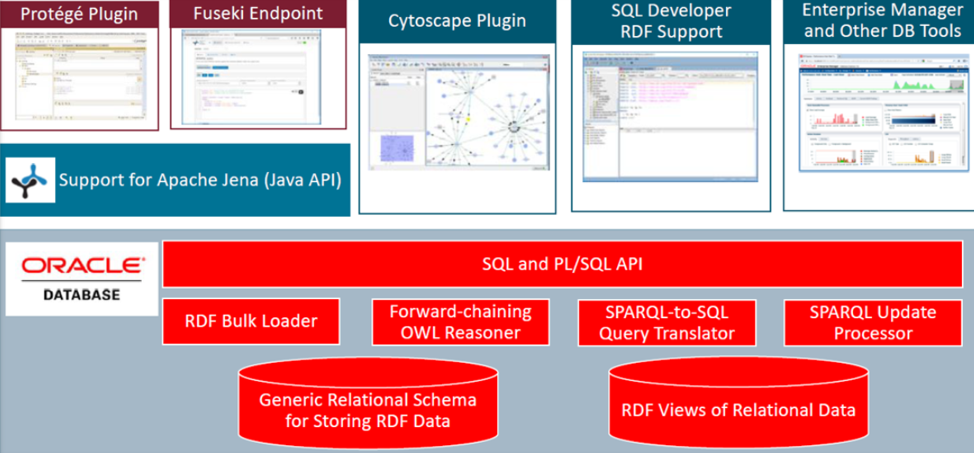
Oracle Semantic Technologies
Note
Oracle Relational Databaseis the single source of truth (i.e. Data Warehouse).Oracle RDF Graphis the RDF triplestore.
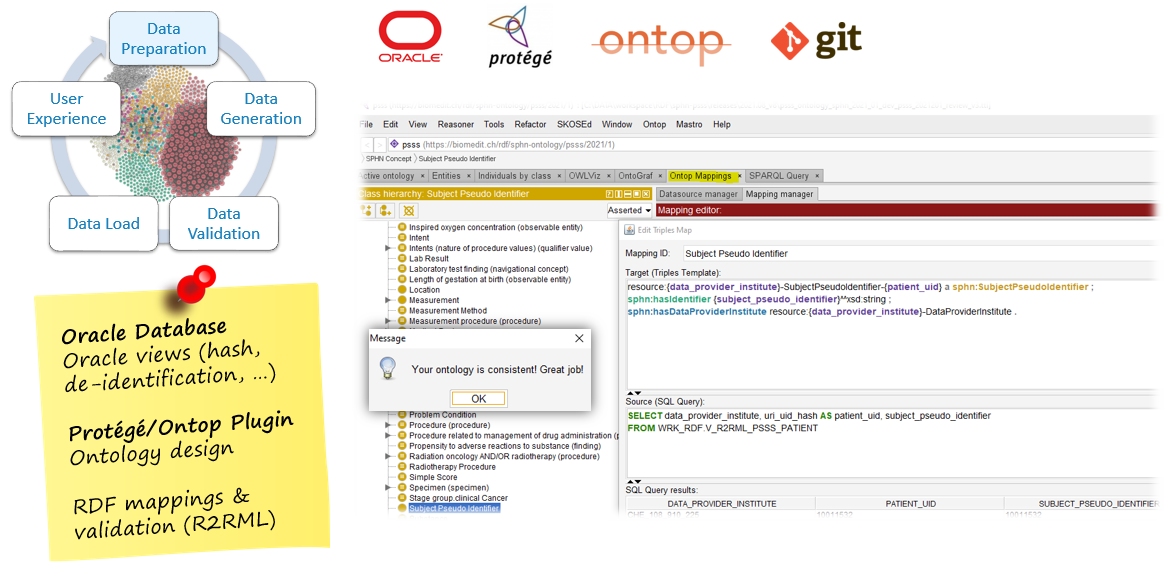
CHUV Technology Stack

Note
HORUSis the CHUV platform that encompasses in particular a Patient Consent Manager for the De-Identification of the data and a Clinical Data Warehouse (Oracle).Oraclehosts the CHUV Data Warehouse and the RDF Graph Triplestore.Jenkinsis the automation server for the execution of the pipeline.Ontopis a Virtual Graph System used to materialize RDF Data (Turtle format) based on the defined R2RML mappings (Oracle to RDF: Data Generation).Protégéis used to edit the ontologies and to design R2RML (RDB to RDF Mapping Language) mappings (Ontop plugin: Data preparation).Jena Adapteris a Java-based interface used to load RDF data into Oracle RDF Triplestore (Data Load).Oracle RDF Graph Server and Query UIprovides REST Services and a Query UI (SPARQL endpoint: User experience).
Implementation
Graph Life Cycle and Pipeline
Data Preparation
Design and curate ontologies (Protégé)
ETL all required data into Oracle (Staging Tables, …)
Develop Oracle views to expose de-identified data (Datawarehouse, Consent Manager, …)
Develop R2RML mappings (Protégé/Ontop: Oracle DB to RDF)
Data Generation
Generate RDF data files (Turtle format)
Data Validation
Check RDF data format (Shacl rules)
Check RDF data quality (SPARQL queries)
Data Transfer and Load
Transfer RDF data with SETT
Load RDF data (files) into Oracle Graph (model)
User Experience
Explore and analyze data
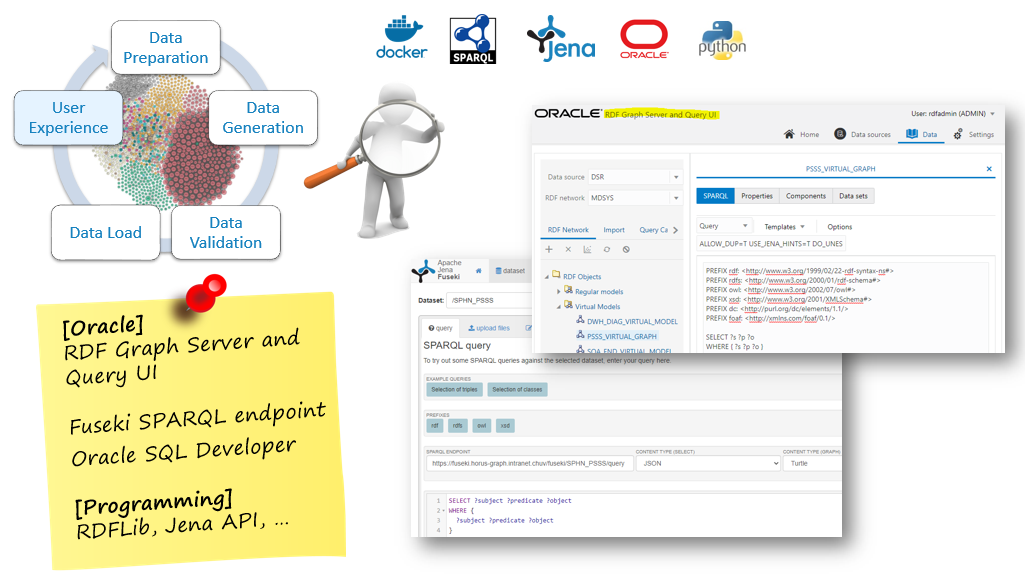
Example of use
A researcher can query from a Python notebook the SPARQL endpoint (e.g. Fuseki) to explore and analyze data.
Example of a Jupyter notebook for PSSS Data (Sepsis project)
SPARQL query
PREFIX rdf:<http://www.w3.org/1999/02/22-rdf-syntax-ns#>
PREFIX rdfs:<http://www.w3.org/2000/01/rdf-schema#>
PREFIX sphn:<https://biomedit.ch/rdf/sphn-ontology/sphn#>
PREFIX resource:<https://biomedit.ch/rdf/sphn-resource/>
PREFIX xsd:<http://www.w3.org/2001/XMLSchema#>
PREFIX psss:<https://biomedit.ch/rdf/sphn-ontology/psss/>

select distinct ?patient ?stay ?temperature ?temperature_datetime ?infection_datetime
where {
    ?infection  rdf:type psss:InfectionSuspected;
                sphn:hasSubjectPseudoIdentifier ?patient;
                sphn:hasAdministrativeCase ?stay;
                psss:hasInfectionSuspectedDateTime ?infection_datetime ;
                psss:hasInfectionSuspectedValue ?infection_suspicion .
    FILTER(?infection_suspicion = "yes") .

    ?temp   rdf:type sphn:BodyTemperature;
            sphn:hasSubjectPseudoIdentifier ?patient ;
            sphn:sphn:hasAdministrativeCase ?stay;
            sphn:hasBodyTemperatureValue ?temperature ;
            sphn:hasDateTime ?temperature_datetime .
    FILTER(?stay=resource:CHE_108_910_225-AdministrativeCase-S28174321571) .
}
order by ?patient ?temperature_datetime
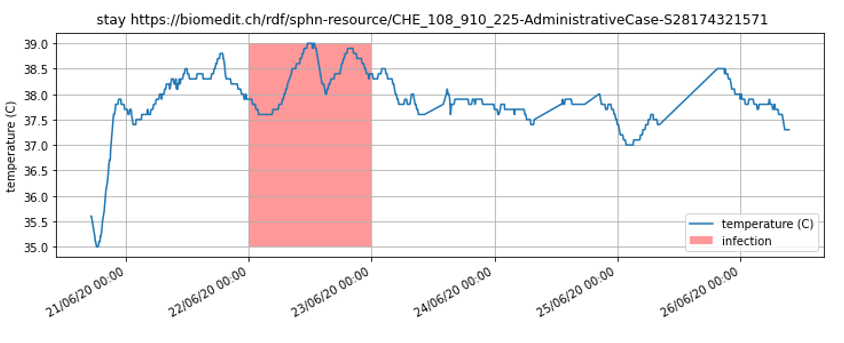
Infection and Body Temperature over time for a Patient Encounter
Python code (Jupyter notebook)
from SPARQLWrapper import SPARQLWrapper, JSON
import pandas as pd
import json
import ssl
from getpass import getpass
import numpy as np
import matplotlib.pyplot as plt
import matplotlib.dates as mdates
%matplotlib inline
v_user = "admin"
v_password = getpass(prompt="Please type the password of Fuseki user " + v_user  + ": ")

v_endpoint_url = "https://fuseki.horus-graph.intranet.chuv/fuseki/CHUV_PROD_WRK_RDF/query"

prefixes = {
    "xml": "http://www.w3.org/XML/1998/namespace",
    "xsd": "http://www.w3.org/2001/XMLSchema#",
    "owl": "http://www.w3.org/2002/07/owl#",
    "rdf": "http://www.w3.org/1999/02/22-rdf-syntax-ns#",
    "rdfs": "http://www.w3.org/2000/01/rdf-schema#",
    "sphn": "https://biomedit.ch/rdf/sphn-ontology/sphn#",
    "resource": "https://biomedit.ch/rdf/sphn-resource/",
    "psss": "https://biomedit.ch/rdf/sphn-ontology/psss/"
}
# SPARQL Query

v_sparql_query = """
PREFIX rdf:<http://www.w3.org/1999/02/22-rdf-syntax-ns#>
PREFIX rdfs:<http://www.w3.org/2000/01/rdf-schema#>
PREFIX sphn:<https://biomedit.ch/rdf/sphn-ontology/sphn#>
PREFIX resource:<https://biomedit.ch/rdf/sphn-resource/>
PREFIX xsd:<http://www.w3.org/2001/XMLSchema#>
PREFIX psss:<https://biomedit.ch/rdf/sphn-ontology/psss/>

select distinct ?patient ?stay ?temperature ?temperature_datetime ?infection_datetime
where {
    ?infection  rdf:type psss:InfectionSuspected;
                sphn:hasSubjectPseudoIdentifier ?patient;
                sphn:hasAdministrativeCase ?stay;
                psss:hasInfectionSuspectedDateTime ?infection_datetime ;
                psss:hasInfectionSuspectedValue ?infection_suspicion .
    FILTER(?infection_suspicion = "yes") .

    ?temp   rdf:type sphn:BodyTemperature;
            sphn:hasSubjectPseudoIdentifier ?patient ;
            sphn:sphn:hasAdministrativeCase ?stay;
            sphn:hasBodyTemperatureValue ?temperature ;
            sphn:hasDateTime ?temperature_datetime .
    FILTER(?stay=resource:CHE_108_910_225-AdministrativeCase-S28174321571) .
}
order by ?patient ?temperature_datetime
"""
# SPARQL Wrapper

sparql = SPARQLWrapper(v_endpoint_url)
sparql.setCredentials(v_user,v_password)
sparql.setQuery(v_sparql_query)
sparql.setReturnFormat(JSON)

results = sparql.query().convert()

df = pd.DataFrame(columns=results["results"]["bindings"][0].keys())
for k, result in enumerate(results["results"]["bindings"]):
    s = pd.Series({key: result[key]["value"] for key in result.keys()}, name=k)
    df = df.append(s)

print("Endpoint:", v_endpoint_url)
display(df)
# Pandas Dataframe formatting

df = df.set_index('stay')
df['temperature_datetime'] = df['temperature_datetime'].apply(pd.to_datetime)
df['infection_datetime'] = df['infection_datetime'].apply(pd.to_datetime)
df['temperature'] = df['temperature'].astype(np.float)
# Results plotting

for s in df.index.unique()[:4]:
    d_infection = df.loc[s, 'infection_datetime'].drop_duplicates()
    temp = df.loc[s, 'temperature']

    fig, ax = plt.subplots(figsize=(12,4))
    plt.plot(df.loc[s, 'temperature_datetime'], temp, label='temperature (C)')

    for i in d_infection:
        plt.fill_betweenx(  y=np.linspace(temp.min(),temp.max(),2),
                            x1=i,
                            x2=i+pd.to_timedelta('24 hours'),
                            facecolor='r',
                            alpha=0.4,
                            label='infection')

    plt.title(f'stay {s}')
    plt.xlabel('datetime')
    plt.ylabel('temperature (C)')
    plt.grid()
    plt.legend(loc='lower right')
    date_format = mdates.DateFormatter('%d/%m/%y %H:%M')
    ax.xaxis.set_major_formatter(date_format)
    fig.autofmt_xdate()
    plt.show()