Assessment concepts
The set of Assessment concepts enables the representation of evaluations that take into account a predefined scale, classification, staging or scoring system and their results.
Concept design
The concept design allows for sharing data about the assessment scale and the assessment result either as code or as free text (string) as well as sharing information about the type of person who performed the assessment and the range of the assessment scale where applicable.
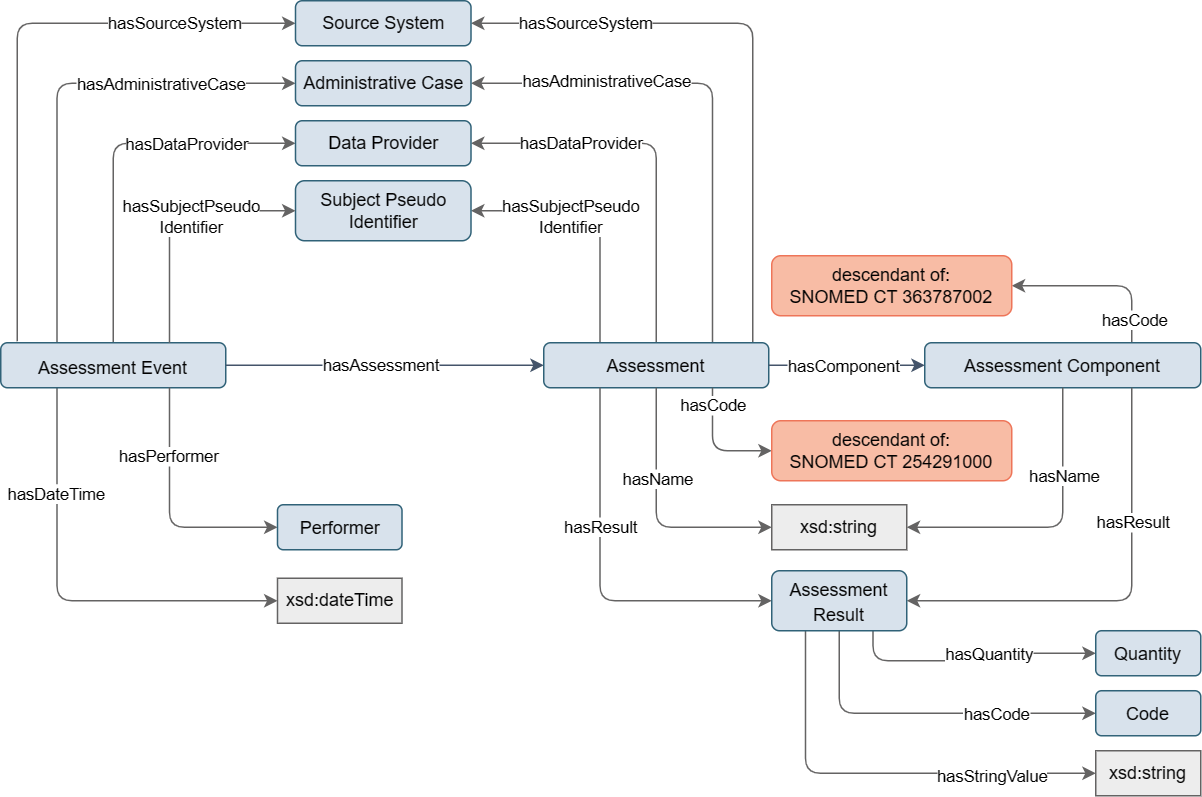
Figure 1. Design of the Assessment data concepts.
Examples for data delivery
Glasgow Coma Scale
The Glasgow Coma Scale is a clinical assessment scale that evaluates a patient’s level of consciousness using three components: eye opening (E), verbal response (V), and motor response (M). The total GCS score is derived as the sum of the individual component scores. Table 1 below shows all the possible scores against each kind of response.
Component |
Score |
Response |
|---|---|---|
Eye Response |
1 |
No eye-opening |
2 |
Eyes opening to pain |
|
3 |
Eyes opening to command |
|
4 |
Eyes open spontaneously |
|
Verbal Response |
1 |
No verbal response |
2 |
Incomprehensible sounds |
|
3 |
Inappropriate words |
|
4 |
Confused |
|
5 |
Orientated |
|
Motor Response |
1 |
No motor response |
2 |
Abnormal extension to pain |
|
3 |
Abnormal flexion to pain |
|
4 |
Withdrawal from pain |
|
5 |
Localizing pain |
|
6 |
Obeys commands |
Figure 2 shows how the assessment concepts can be used to instantiate an example of GCS assessment for a patient with brain injury. The Assessment Component instances are instantiated to record scores in each of the three categories: opens eyes when spoken to (E3), speaks but is disoriented (V4) and obeys commands (M6). The overall result of 13 is recorded as an Assessment Result that represents a mild brain injury or concussion.
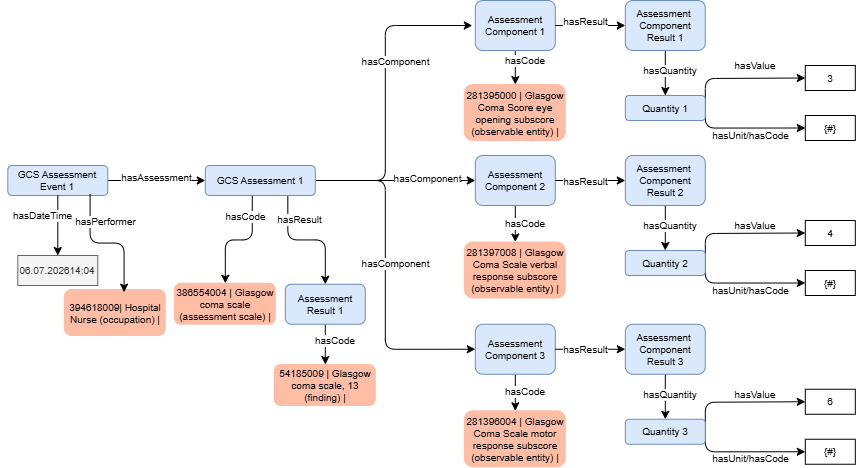
Figure 2. Example of GCS.
Sequential Organ Failure Assessment
The Sequential Organ Failure Assessment (SOFA) score is a standardized clinical assessment used in intensive care medicine to monitor disease severity over time and to quantify the degree of organ dysfunction in critically ill patients.
The SOFA score evaluates six organ systems. The different SOFA score components and their corresponding SNOMED CT codes are presented in Table 2 below:
SOFA Score Components |
Corresponding SNOMED CT Codes |
|---|---|
Respiratory |
78064003 | Respiratory function (observable entity) | |
Coagulation |
404995006 | Blood coagulation status (observable entity) | |
Liver |
79036002 | Liver function (observable entity) | |
Cardiovascular |
70337006 | Cardiovascular function (observable entity) | |
Central nervous system |
1860694000 | Central nervous system function (observable entity) | |
Renal |
11953005 | Renal function (observable entity) | |
Each organ system is assigned a score from 0 (normal function) to 4 (severe dysfunction). The individual component scores are summed to produce a total SOFA score ranging from 0 to 24, with higher scores indicating greater organ dysfunction and an increased risk of mortality.
The Sequential Organ Failure Assessment (SOFA) and the individual component scores can be instantiated with the assessment concepts. Figure 3 shows an example in which a patient has a total SOFA score of 12, derived from the scores of the six individual components. Each component score is based on the patient’s corresponding clinical measurement(s).
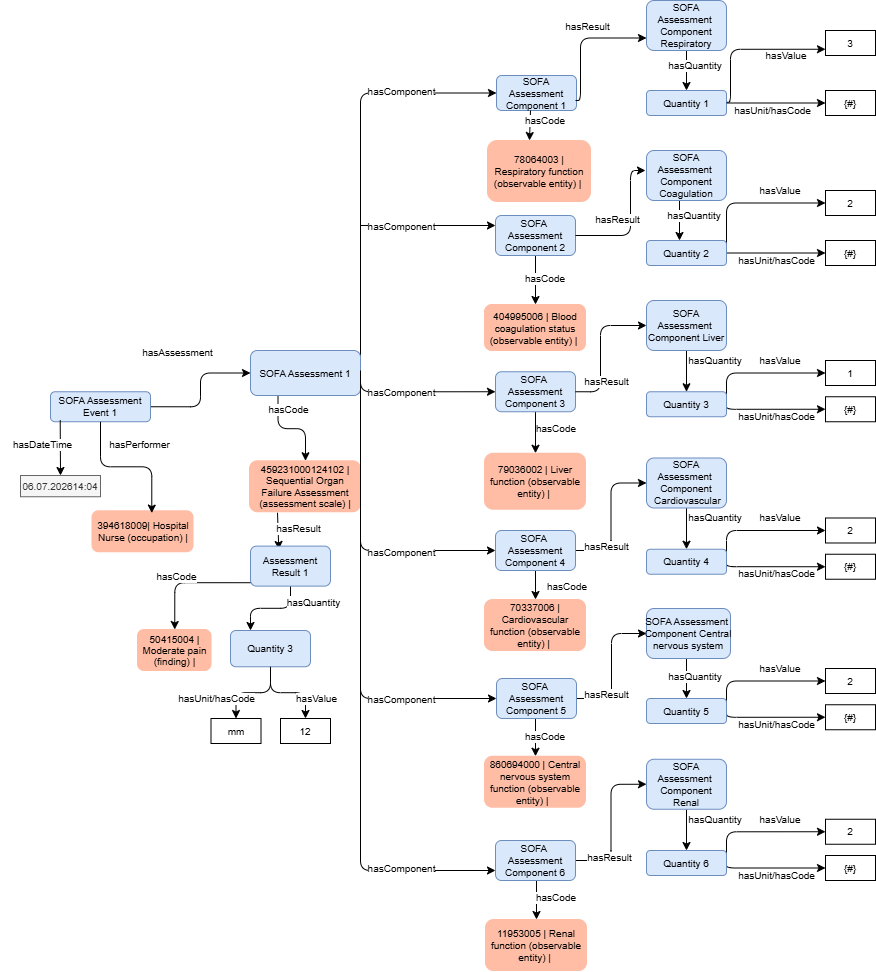
Figure 3. Example of SOFA.
Visual Analog Scale
The Visual Analog Scale (VAS) is a measurement tool used to quantify subjective experiences that cannot be measured directly, such as pain.
It consists of a straight unnumbered line, usually 10 cm (100 mm) long, with two opposite endpoints, where one end means “no pain” and the other means “the worst possible pain”. The patient marks a spot on the line and the pain score is then calculated by measuring the distance from the zero-point to the patient’s mark with a ruler.
Figure 4 below shows an example of using SPHN Assessment concepts for recording a patient’s response to pain according to the Visual Analog Scale (VAS). On a scale of 0-100 mm, the patient marked a point at 65 mm, which means he has moderate pain.
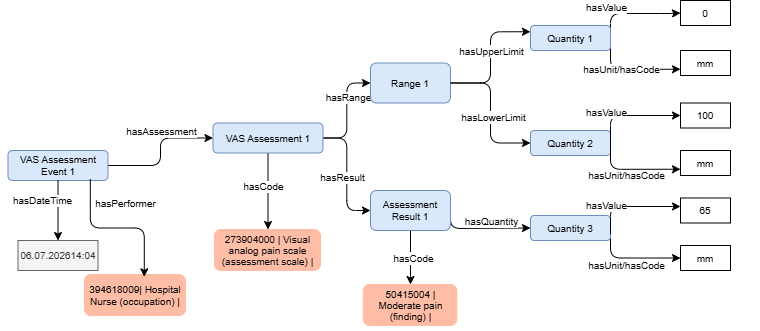
Figure 4. Example of VAS.
Guideline for data delivery
General
It is recommended to either request/provide the total score or the single sub scores depending on the granularity needed for the research question.
SNOMED CT and LOINC feature a broad selection of codes for multiple standardized assessment measures (survey instruments) including staging and scores.
For SNOMED CT, the value set of the code-attribute of Assessment includes the hierarchies “Staging and scales”, “Procedure”, and “Observable entity”, and the value set of the code-attribute of Assessment Component includes the hierarchies “Procedure” and “Observable entity”.
The recommended procedure on code usage is as follows:
Coding systems: SNOMED CT > LOINC, i.e., use of SNOMED CT is the preferred option if available
Use of SNOMED CT hierarchies: Staging and scales > Procedure > Observable entity, i.e., codes from the “Staging and scales” hierarchy are the most preferred option
If a code is missing it should be requested as a SNOMED CT code under the “Staging and scales” hierarchy (at https://ch-rmp.snomedtools.org/en).
Assessment and Assessment Component
If SNOMED CT provides a code for the scale (staging system or classification), then the hasCode property should be populated with an instance of SNOMED CT code. Only if there is no SNOMED CT code available the hasName property should be populated.
Duplicate information should be avoided, i.e., if there is a code available, a name should NOT be provided in addition.
Range
Sometimes it is beneficial to be able to express the range of the scale of an assessment, for example the score on a visual analog scale (VAS). VASs may for example range from 0 to 10 or 0 to 100 and depending on the data provider different scales may be used. A range is therefore helpful to put a result, e.g., 9, into perspective.
Ideally, range information is implicitly covered by a suitable code for the Assessment or Assessment Component, but in absence of such codes for all scales the range attribute provides an alternative.
Delivery of the range-attribute is optional and the range information may not be available in clinical data warehouses. If desired, it would be up to projects to enrich the knowledge graph accordingly.
In case a code for the assessment scale already conveys the information or the respective range is considered common knowledge, the range should not be delivered to avoid duplication of information. For example, Apgar subscores allow a range of 0 to 2, yet no range should be delivered since this is common knowledge.
The range information should only be delivered if there is no other means to derive it from the available information.
The range of an Assessment Component indicates the range of the subscores. The range of the Assessment indicates the range of the total score.
Note: The SPHN Semantic Working Group has discussed whether links to the range attribute should be added to Assessment and Assessment Component or rather to Assessment Result. In the latter case one would interpret the range as the interval results can potentially fall into. The range, however, refers to the numerical range of the scale of the assessment, not the results. Linking it to the Assessment Result may therefore be misleading as it could be misinterpreted as the range being the actual result (“The result is a range of 0-100.”), in particular as the meaning of range is not as clearly defined as for reference ranges. It has thus been decided to establish the links Assessment to Range and Assessment Component to Range.
Assessment Result
Numeric results should be instantiated via AssessmentResult.hasQuantity (see examples in figure 2 and 3) using the UCUM unit {#} (“number”).
Non-numeric results should be instantiated as code if a code (from SNOMED CT or other resource) is available.
Only if no code is available for a non-numeric result, AssessmentResult.hasStringValue should be instantiated.
If the result is a code, such as the SNOMED CT Apgar finding code (for the Apgar score assessment scale), the most specific code reflecting the source data available should be used, e.g. 169901001 | Apgar at 1 minute = 4 (finding) | is preferable over 275307002 | Apgar normal (finding) | (if temporal information is available).
For an overview of preferred SNOMED CT codes, please check the Assessment concept documentation on the Git-repository of the SPHN Semantic Interoperability Framework. Please consult the latest version of the Assessment- documentation (Addendum: “Scores and Scales in SNOMED CT”).
Example for semantic inheritance
The assessment concept design can be used to create specific assessment concepts that are required, for example, if value sets need to be limited (restrictions) or additional information needs to be expressed or linked. The representation of the tumor grades is such an example: the Tumor Grade Assessment Event concept has been created inheriting from the Assessment Event concept, and the Tumor Grade Assessment concept has been created inheriting from the Assessment concept.
Figure 4 illustrates the inheritance as well as the associated restriction of the code in this example. Tumor Grade Assessment hasCode contains the following value set specification: descendant of: SNOMED CT 277457005 |Histological grading systems (staging scale)|, which is more restrictive than the value set of the more general concept of Assessment (SNOMED CT and LOINC, with a restriction for SNOMED CT to descendant of: 254291000 |Staging and scales (staging scale)|; descendant of: 363787002 |Observable entity (observable entity)|; descendant of: 71388002 |Procedure (procedure)|).
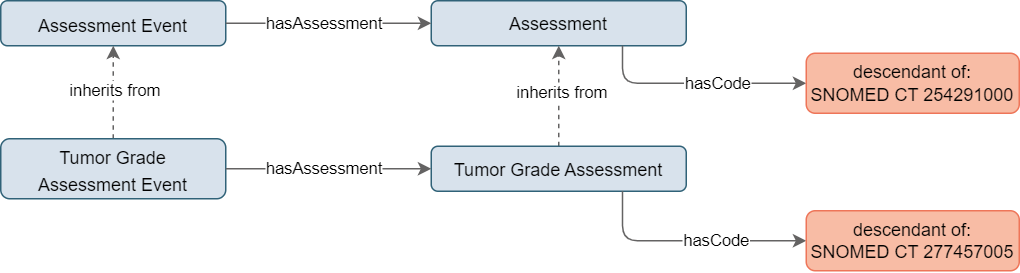
Figure 4. Example of tumor grade representation based on the Assessment concept design.