SPHN Metadata Catalog
Note
Watch the introductory video of the SPHN Metadata Catalog here
The SPHN Metadata Catalog was developed with the goal of facilitating data discovery and reusability. At its core, it serves as a portal, enabling users to easily explore catalogs and datasets generated by SPHN-funded and SPHN-related projects.
The SPHN Metadata Catalog was developed for:
Human readability: Offers a human-readable interface that presents catalogs and datasets in an accessible, understandable manner, enabling researchers and stakeholders to identify and evaluate relevant datasets.
Machine readability: Provide a machine-readable representation that promotes the automated discovery, sharing, and reusability of metadata in alignment with the FAIR principles.
It acts as a bridge between projects and data users, supporting exploration of the available qualitative and quantitative metadata.
The SPHN Metadata Catalog consists of two key components:
SPHN FAIR Data Point: Responsible for hosting and displaying rich, qualitative metadata about available catalogs and datasets.
SPHN Schema Scope: Provides an interactive visualization of the data schemas and the associated quantitative metadata of available catalogs and datasets.
Together, these components offer a comprehensive and user-friendly environment that maximizes the visibility of SPHN datasets and promotes data sharing within SPHN and, more broadly, in Switzerland.
SPHN FAIR Data Point
The SPHN FAIR Data Point (FDP) is the entrypoint of the SPHN Metadata Catalog, designed to make metadata about SPHN datasets and catalogs easily findable, accessible, and reusable. Built on top of the reference implementation of the FAIR Data Point, the SPHN FDP re-uses several standards for representing catalogs and datasets.

Figure 1. Implementation of the SPHN FAIR Data Point. Red color signifies newer use-case-specific additions on top of reference implementation of the FAIR Data Point.
The SPHN FDP provides a platform where users can both browse and interact with qualitative metadata describing the datasets. More importantly, the FAIR Data Point is designed for both human exploration and machine interoperability, ensuring that metadata serves a broad range of needs across the SPHN community.

Figure 2. Landing page of the SPHN FAIR Data Point. The different catalogs are listed in alphabetical order displaying the title of the project, a brief abstract and few important metadata.
The SPHN FAIR Data Point is available at: https://fdp.dcc.sib.swiss
Exploration
The SPHN FAIR Data Point offers an intuitive web interface that enables users to browse and search metadata about catalogs and datasets. Users can:
View high-level summaries of catalogs and datasets, including titles, descriptions, keywords, and provenance information
Explore relationships between catalogs, datasets, projects, and data providers
Access detailed metadata that provide richer context about the datasets, including the intended use, associated publications, and conditions for access
Navigate between different layers of metadata (e.g., from a catalog to an individual dataset to its corresponding distribution) to build a full understanding of the available resources
Access interactive exploration of schemas and data density visualizations via SPHN Schema Scope (category “Interactive Exploration”, availability depending on catalog and dataset)

Figure 3. Page showing the metadata of a catalog from the SwissPedHealth National Data Stream
Metadata
The SPHN FAIR Data Point organizes and presents a standardized set of qualitative metadata elements that describe each catalog and dataset. These elements These metadata are divided into qualitative and quantitative components, reflecting both general project-level descriptions and aggregated characteristics derived from a count inventory from SPHN-compliant knowledge graph of interest.
Qualitative Metadata
Qualitative metadata captures high-level contextual information about a project and the datasets it produces. This information is supplied by participating projects using a tabular metadata template (available under CC BY 4.0), designed to be accessible to data owners and data stewards regardless of their technical background. Typically, a project corresponds to a single Catalog, with each dataset generated during the project’s lifetime represented as an individual Dataset. Metadata are submitted periodically or on request, ensuring that the published descriptions remain current.
Submitted metadata form the basis for a machine-readable RDF representation of the catalog, where template fields are mapped to established standards including DCMI Metadata Terms, DCAT, DCAT-AP, and HealthDCAT-AP. Additional SPHN-specific fields are expressed according to the SPHN Metadata Catalog Schema, a lightweight schema that support the structured description and management of metadata within the SPHN Metadata Catalog.
Consistent with DCAT specifications, the metadata are structured into three core components:
Catalog: The overarching project-level description
Dataset: One or more datasets produced within the Catalog
Distribution: One or more access or delivery mechanisms for each Dataset (e.g., file downloads, API endpoint etc.)
Within this structure, key qualitative metadata elements include:
Title: The official name of the dataset or catalog
Description: A detailed summary of the dataset’s content and purpose
Keywords: Terms that facilitate thematic categorization and discovery
Publisher: The entity responsible for making the data available
Creator: The original producers or collectors of the data
Access Rights: Details about data accessibility and any restrictions
Contact Point: Who to reach out to for more information or access requests
Versioning: Tracking changes and updates to the dataset over time
Related Resources: Links to associated publications or related datasets
The complete list of qualitative metadata elements is defined in the SPHN Metadata Catalog Schema.
Quantitative Metadata
Complementing the qualitative descriptions, the SPHN FAIR Data Point also publishes quantitative metadata, which characterize datasets based on aggregated counts often derived from their underlying SPHN-compliant knowledge graphs.
For SPHN projects sharing RDF data compliant with the SPHN RDF Schema, quantitative metadata are generated using the SPHN Metadata Generator, available as both a Python script and a Docker container (GPLv3). The generator automatically produces and executes SPARQL queries to compute counts of classes, instances, and terminology usage. These results form a count inventory that highlights data density, structural completeness, and terminology coverage (for selected datasets only).
Figure 4. Quantitative metadata summarizing concepts availability. Available concepts delivered within the selected dataset are displayed together with simple aggregated summary statistics such as the total number of instances per concepts and the range (min-max) of instances per patient.
Figure 5. Quantitative metadata summarizing codes frequency. The frequency of codes for each delivered terminology is reported. Codes are grouped into broader categories according to the structure of each terminology. For each category, both the total number of instances and the number of distinct codes are reported.
By standardizing metadata, the SPHN FAIR Data Point ensures that users can quickly assess the relevance, reliability, and reusability of a dataset.
Machine-readability
In addition to human-readable displays, all metadata in the SPHN FAIR Data Point is also exposed in a machine-readable format (i.e. in RDF). This is crucial to enable automated data discovery, integration, and reuse by other systems and applications. The FAIR Data Point makes use of semantic web standards to represent metadata that is machine readable and interoperable.
SPARQL endpoint
The access of metadata is also possible via the following SPARQL enpoint: https://fdp.dcc.sib.swiss/store/fdp/sparql.
This endpoint supports SPARQL 1.1 queries and is publicly accessible. The metadata can be queried using standard tools such as YASGUI, Apache Jena Fuseki or programmatically. Example of federated queries can be found here.
SPHN Schema Scope
The SPHN Schema Scope is available for discovering and exploring the SPHN core dataset and datasets from SPHN-funded projects, allowing to explore individual concepts in the full context of the schema graph. It offers researchers a highly interactive way to visualize data schemas, simplifying the navigation of even the most complex data structures.
The SPHN Schema Scope web service is available at: https://schemascope.dcc.sib.swiss/.
Figure 1. The SPHN Schema Scope graphical user interface.
Basic overview
The graphical user interface of SPHN Schema Scope features two parts:
Control elements for the graph display (→ left side) [jump to section]
schema selection
selection of a concept subset of interest
advanced options of graph display (graph setup, inheritance)
general display options (coloring, display dimensions, labels, type of shapes)
Schema graph, additional metadata, and help (→ tabs on right side) [jump to section]
schema graph
table view of the underlying schema
general schema information, including
version of the schema
licenses of terminologies used
Help-tab for a quickstart introduction
FAIR Data Point
Note
The control elements allow to tailor the graph view to the user’s needs. Most changes will have an immediate impact on the way the graph is displayed.
Specific regions of the graph can be explored in the graph tab. The mouse wheel allows zooming in or out, and the graph can be dragged to an area of interest by holding the left mouse button and moving the mouse.
Control elements
Control elements are primarily located in the control sidebar on the left of the display.
Schema selection
The user can select a project from the dropdown menu (“Choose a project:”) and subsequently a version from the options (versions) available in the dropdown menu “Select a schema version:”. The choices feature SPHN schemas from release 2023.2 onwards and project-specific schemas from National Data Streams (NDSs) and related nested or Lighthouse projects as well as Demonstrator projects and the Federated Dataset.
Figure 2. Selecting a schema of interest in SPHN Schema Scope.
Data density visualization
In case quantitative metadata is available for a combination of project and schema version, dataset(s) will be selectable from the dropdown menu “Available dataset(s) or schema:” (Figure 3).
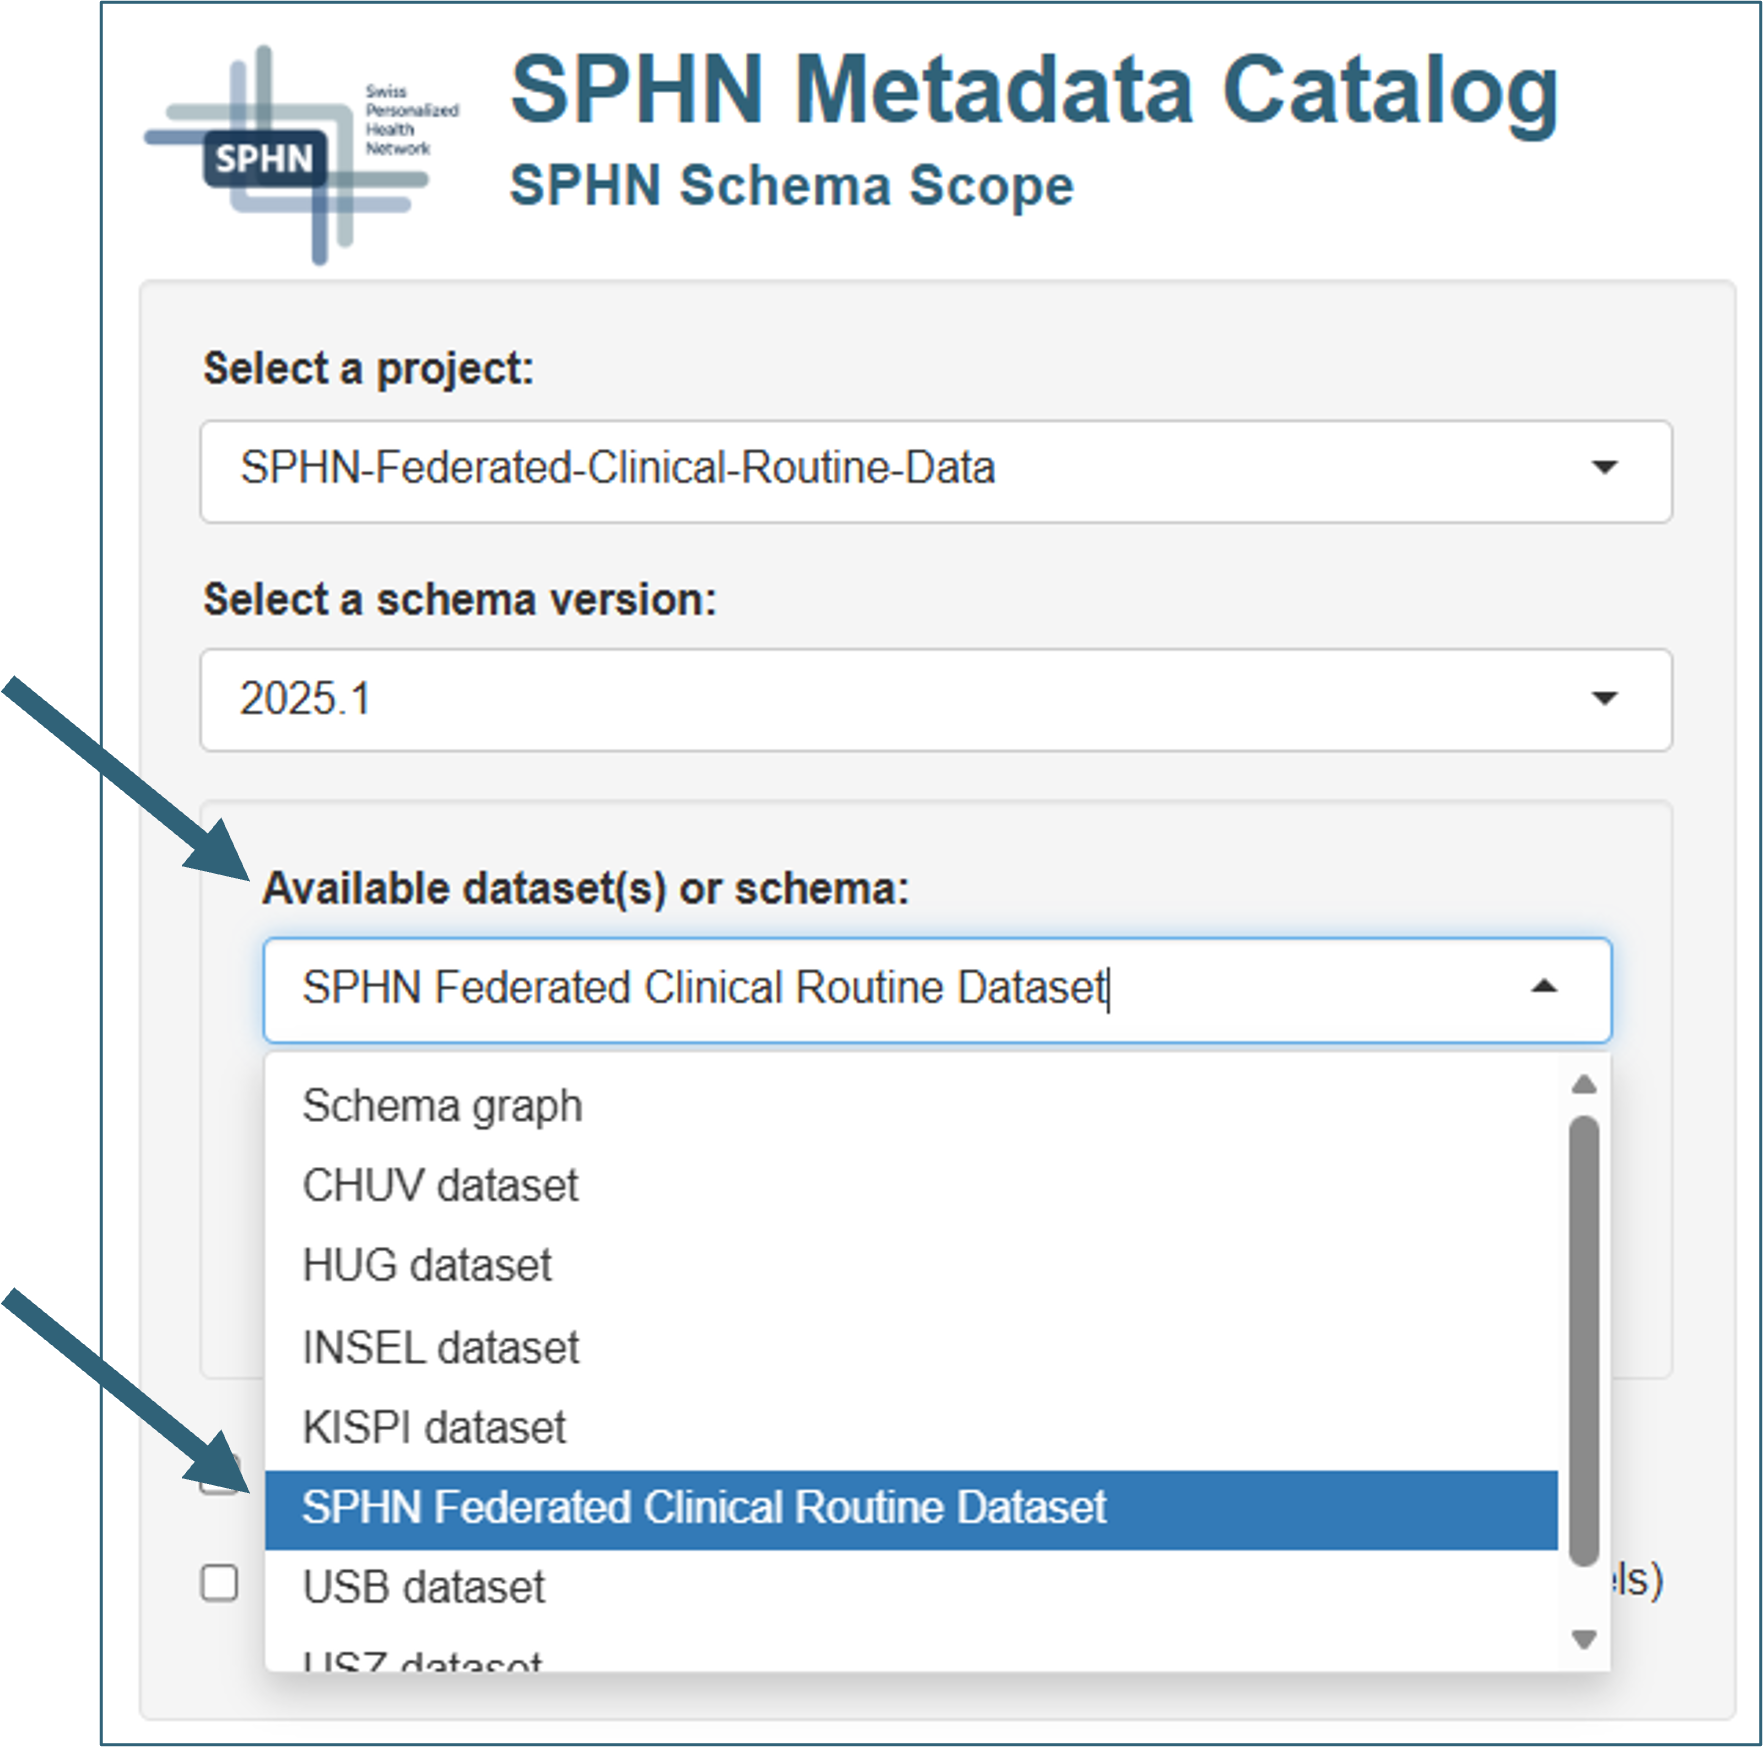
Figure 3. Selecting a dataset of interest in SPHN Schema Scope.
When a dataset is selected, schema graphs are overlaid with instance counts representing data density, and the node size is scaled accordingly (Figure 4). Different node scaling options are available from the dropdown menu “Node scaling mode” (binned, linear, or logarithmic) to accommodate for different spreads of data abundance. Relevant edges represent the prevalence of a property in the data.
When hovering over a node or edge, information on count (Figure 4, insets A and B) and availability (Figure 4, inset C; only when information has been sourced) is displayed. The example shown is from the SPHN Federated Dataset.
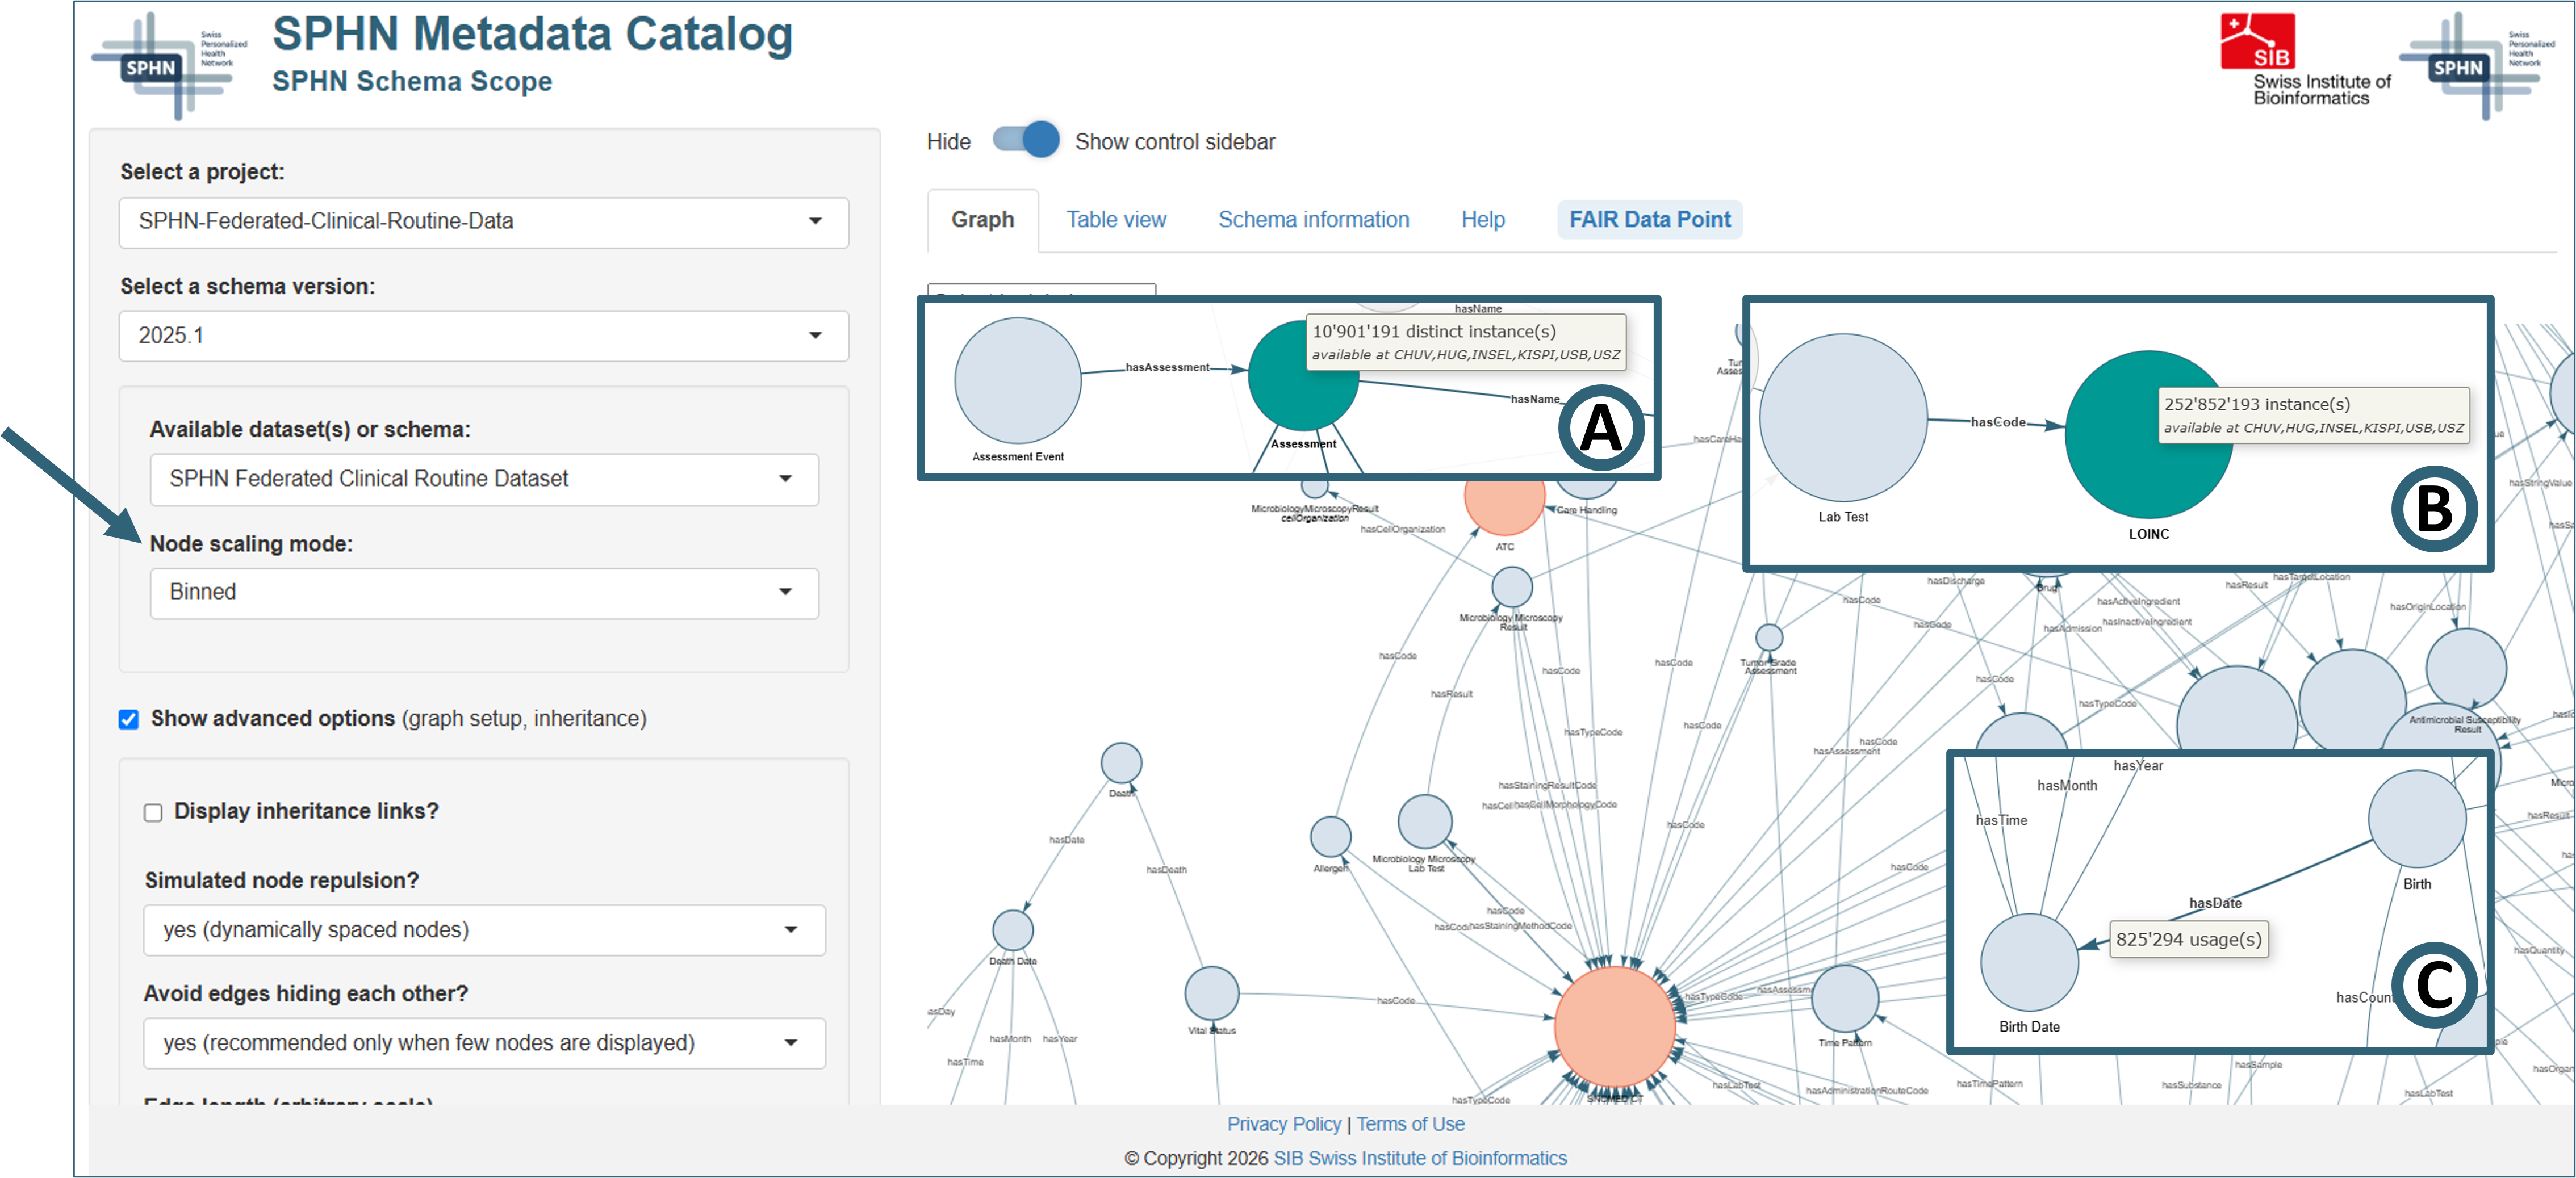
Figure 4. Visualization of data densities in SPHN Schema Scope.
Note that SPHN Schema Scope specifies the prevalence of clinical concepts in the dataset but does not encode or expose any population-level distributions. The aggregated concept counts apply to the full graph only and do not allow any combinatorics or subcohort construction. Therefore, only the full graph can be explored when visualizing data frequencies to ensure correctness of the displayed data.
The combination of schema view and data density offers an immediate and intuitive estimate of data sparsity or abundance, for each concept and terminology. It allows potential secondary users to judge whether the data elements of interest are sufficiently represented and whether a dataset is suitable for the intended purpose.
Showing subsets of a graph
SPHN Schema Scope offers the possibility to explore subgraphs of schema graphs to simplify the navigation of complex data structures. As stated in section Data density visualization, subgraphs can only be explored on schema level, not for quantitative metadata (data densities).
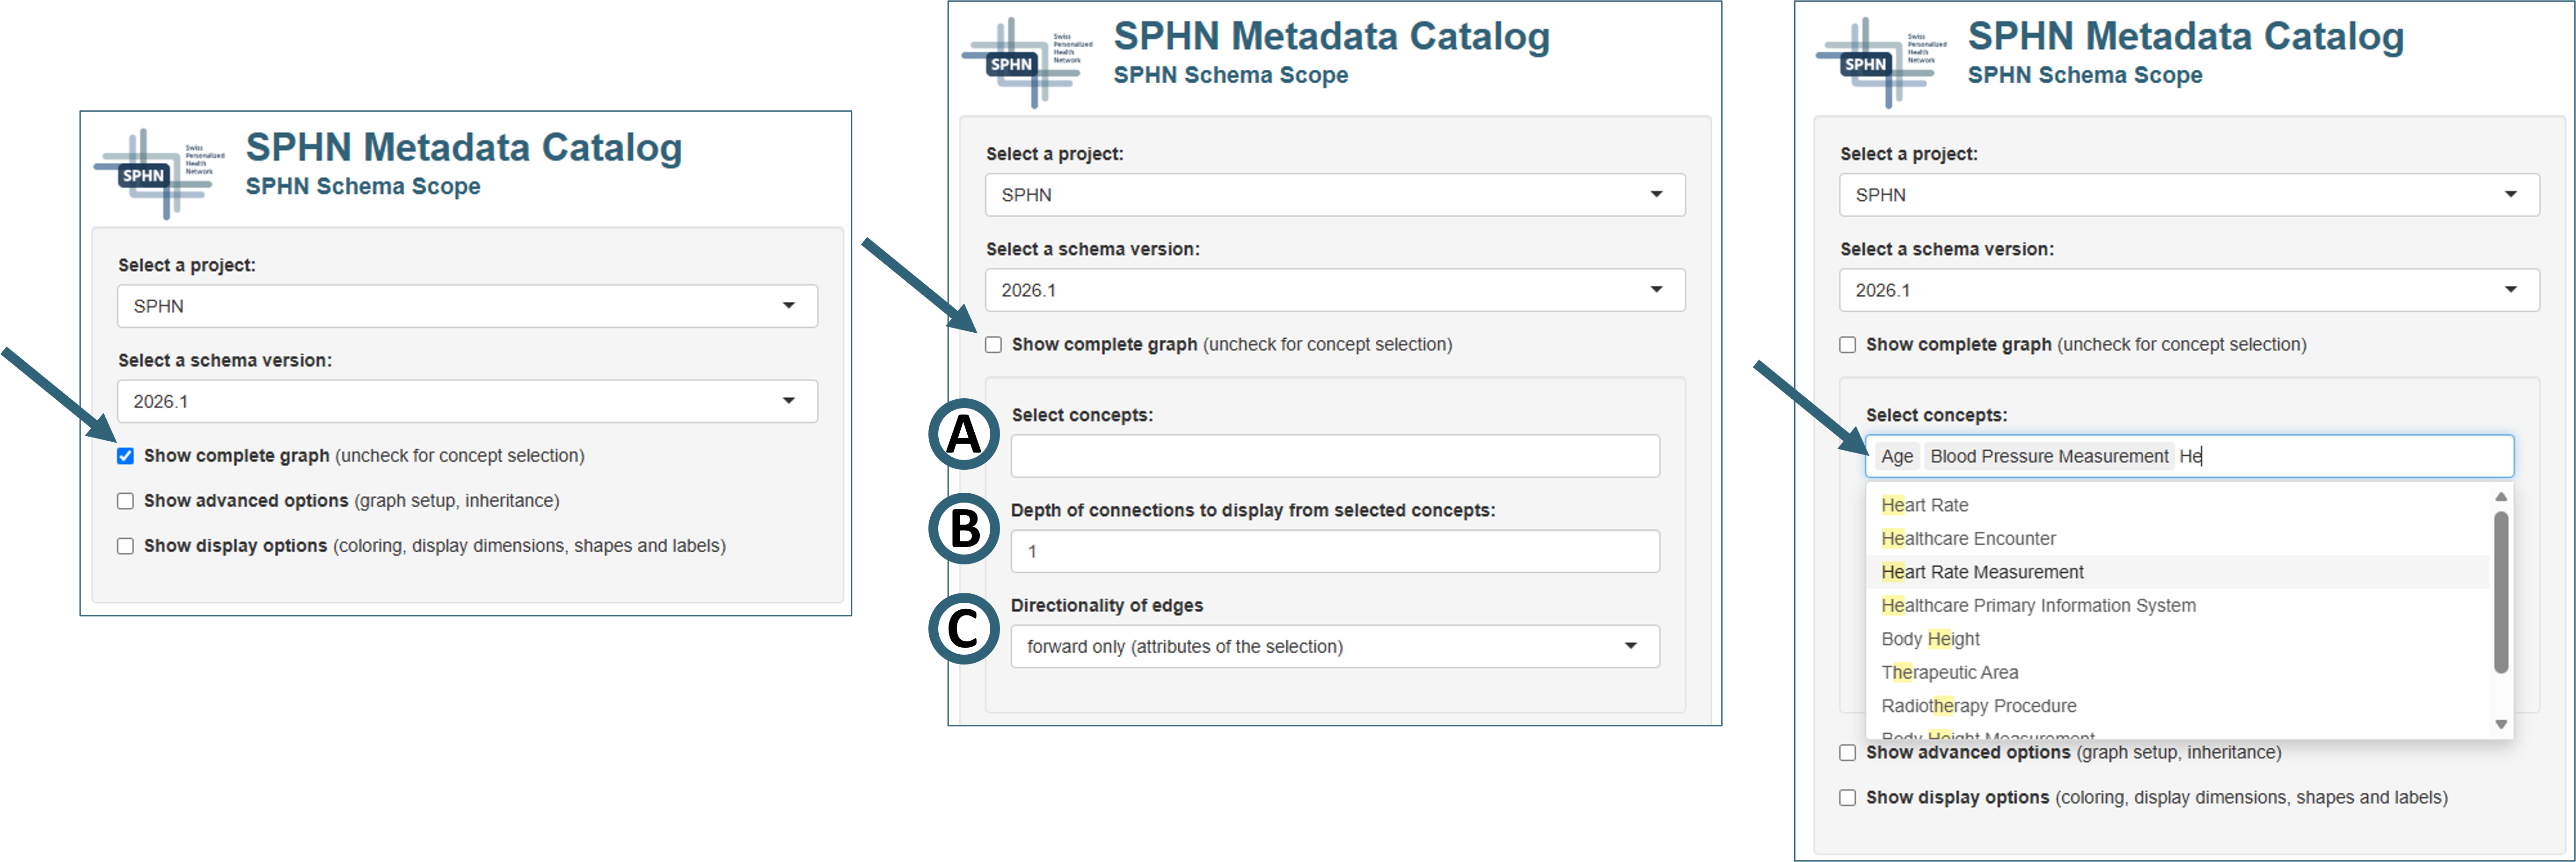
Figure 5. Selecting concepts of interest in SPHN Schema Scope.
Concept selection
Uncheck the box “Show complete graph” to enable the selection of a subset of concepts of interest including additional options.
Note
Select the concepts of interest (Fig. 5A) by choosing from the dropdown menu (“Select concepts”) or by typing in the selection box. The search is case insensitive and will pick up partial matches of the search term regardless of its position, e.g., suggestions for a search of “he” will include Heart Rate, Heart Rate Measurement, but also Body Height or Radiotherapy Procedure.
Depth of connections
Selection of the number of “hops” in the field “Depth of connections to display from selected concepts” (Fig. 6B) in the graph to be shown, starting from the selected concepts.
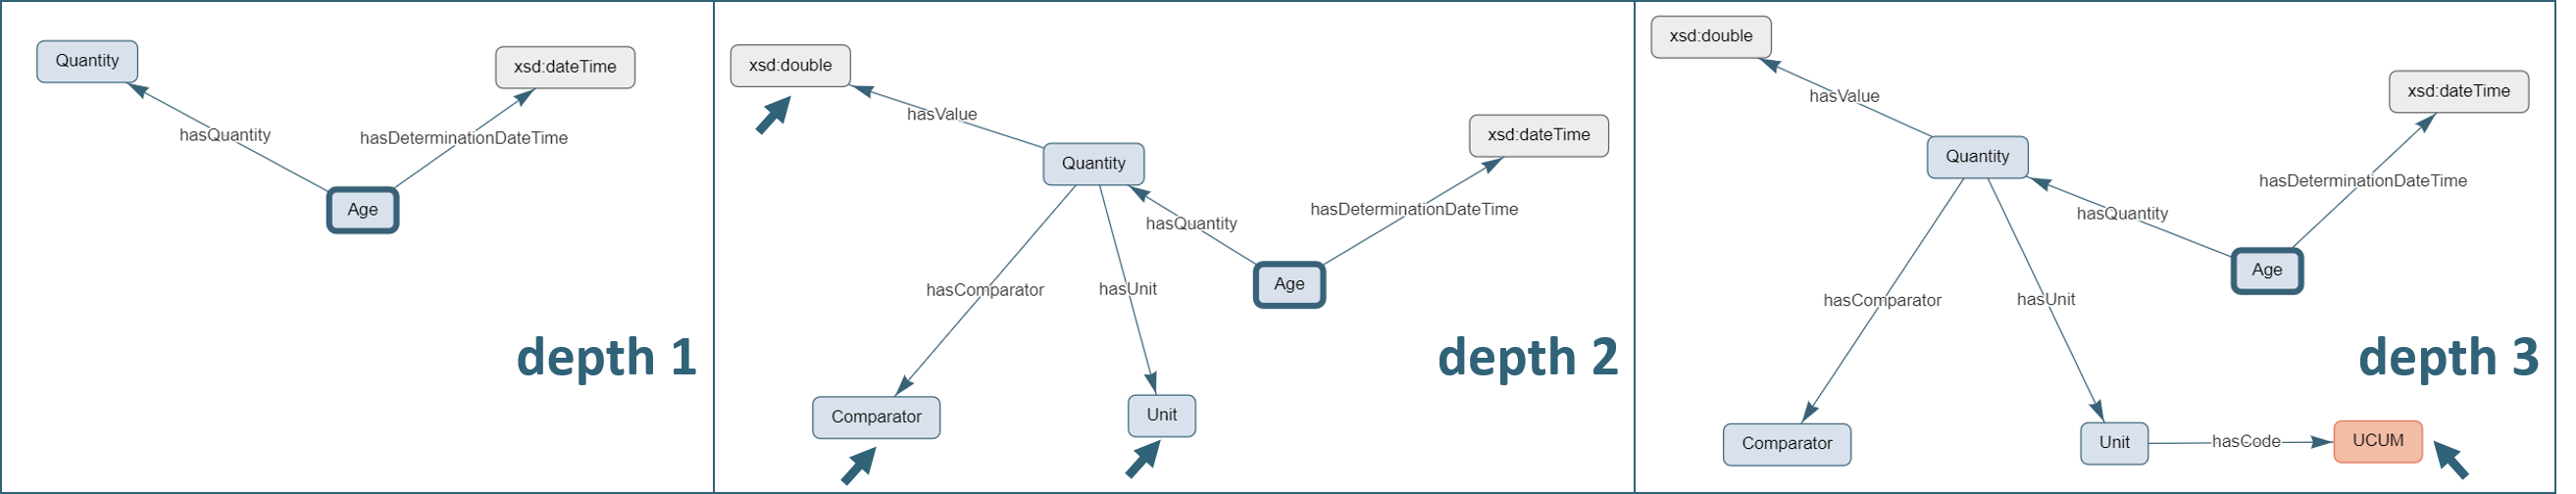
Figure 6. Depths of connections 1 through 3 shown for concept “Age”.
A depth of 1 (left panel) shows directly connected nodes only, while a depth of 2 (center panel) and 3 (right panel) shows nodes which are 1 or 2 additional hops away from the selected concept(s), respectively.
Directionality of edges
Selection of the directionality of links between nodes to be shown (“Directionality of edges”, Fig. 7C):
attributes of the selection, i.e., forward edges (“forward only”)
concepts using the selection, i.e., reverse or backward edges (“backward only”)
or both forward and reverse (“both directions”)
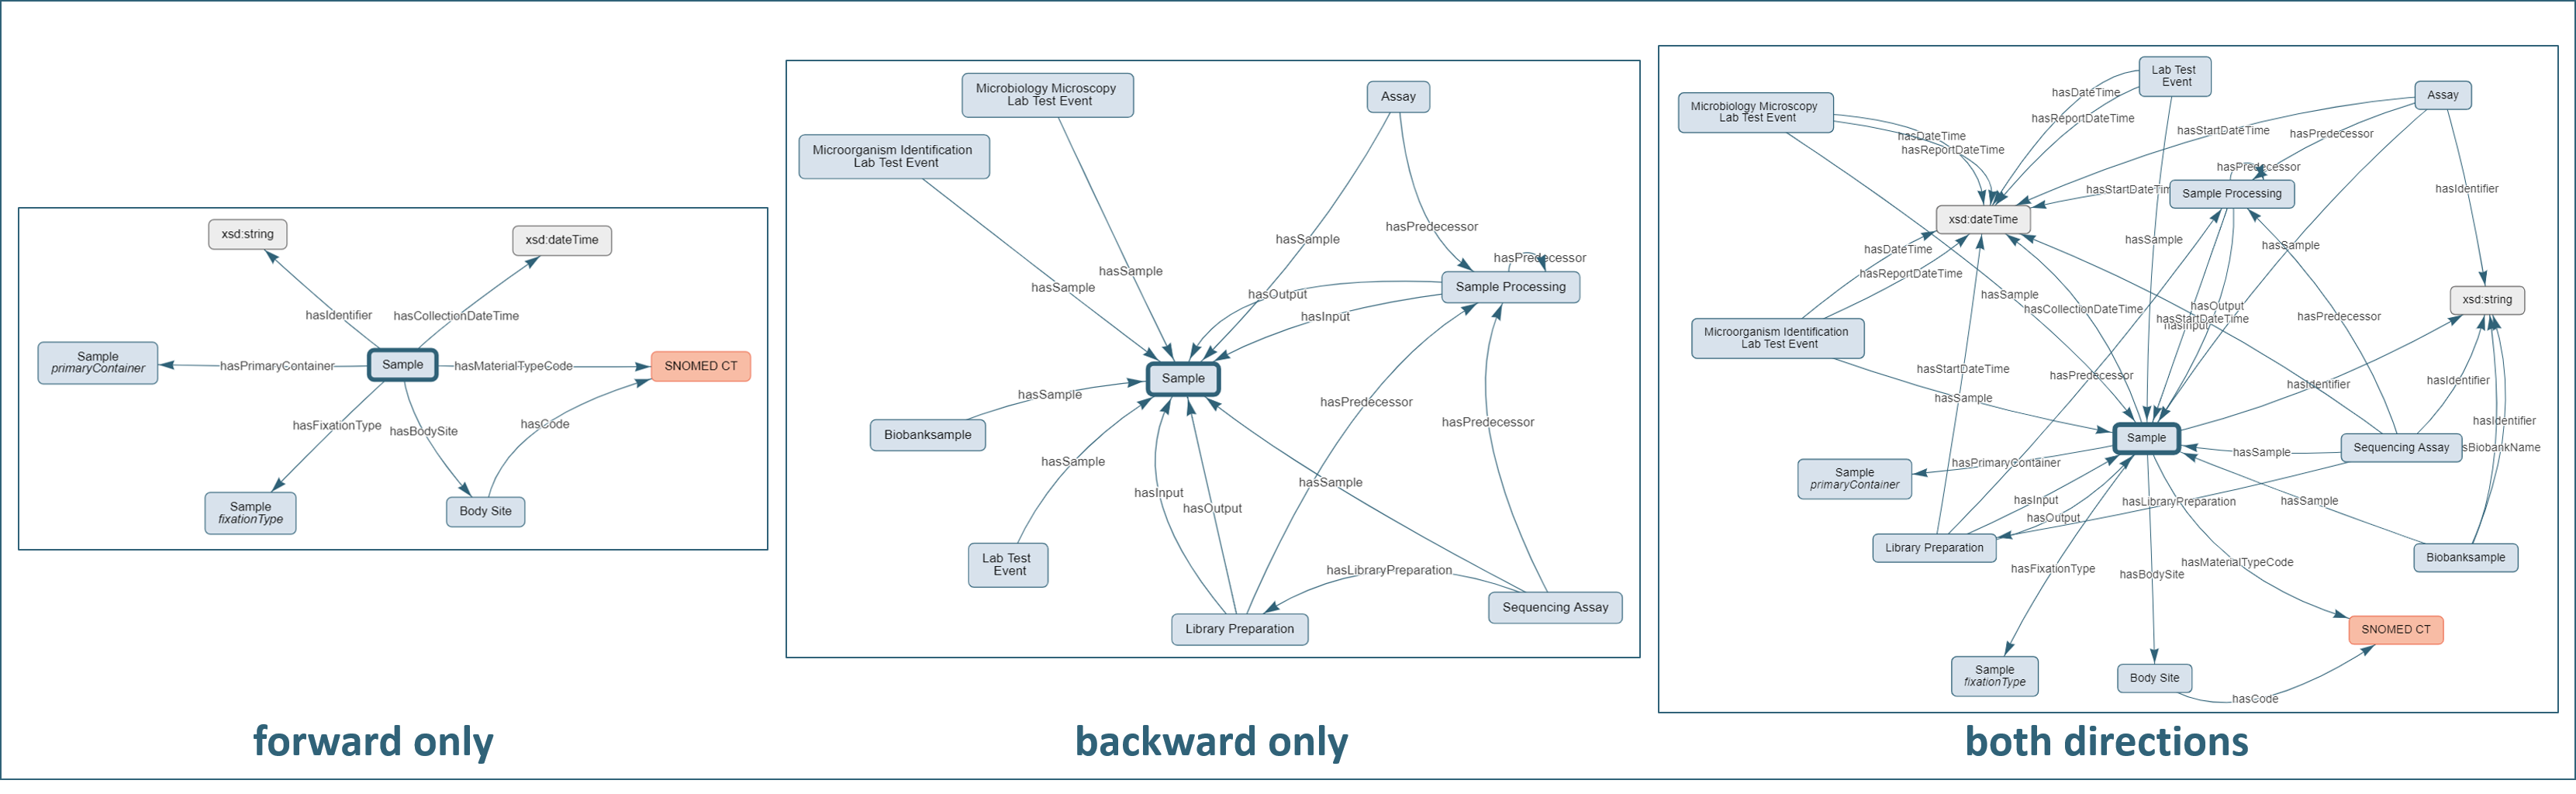
Figure 7. Effect of directionality-option
Sample concept (release 2024.2).
Note that the advanced option “Avoid edges hiding each other?” (see Fig. 8C) was enabled to create the views of Fig. 7.Sample, i.e., the attributes of the concept like the
identifier, material type code, or the body site. The central panel shows the edges targeting or directed “backward” to
Sample, i.e., it shows edges of concepts using Sample, including Sample Processing, Library Preparation,
Assay, or Lab Test Event. The right panel combines the two options showing both directions, therefore all connections from and to the Sample.Note
Increasing the depth or selecting a directionality of “both directions” may quickly expand the subgraph depending on the initial selection. Once the area of interest is determined it may be helpful to expand the initial concept selection by a few concepts along the specific interest to reduce the need to overly increase the depth and to avoid expanding the subgraph unintentionally.
Advanced options
Check the box “Show advanced options” to display additional advanced options for the graph setup.
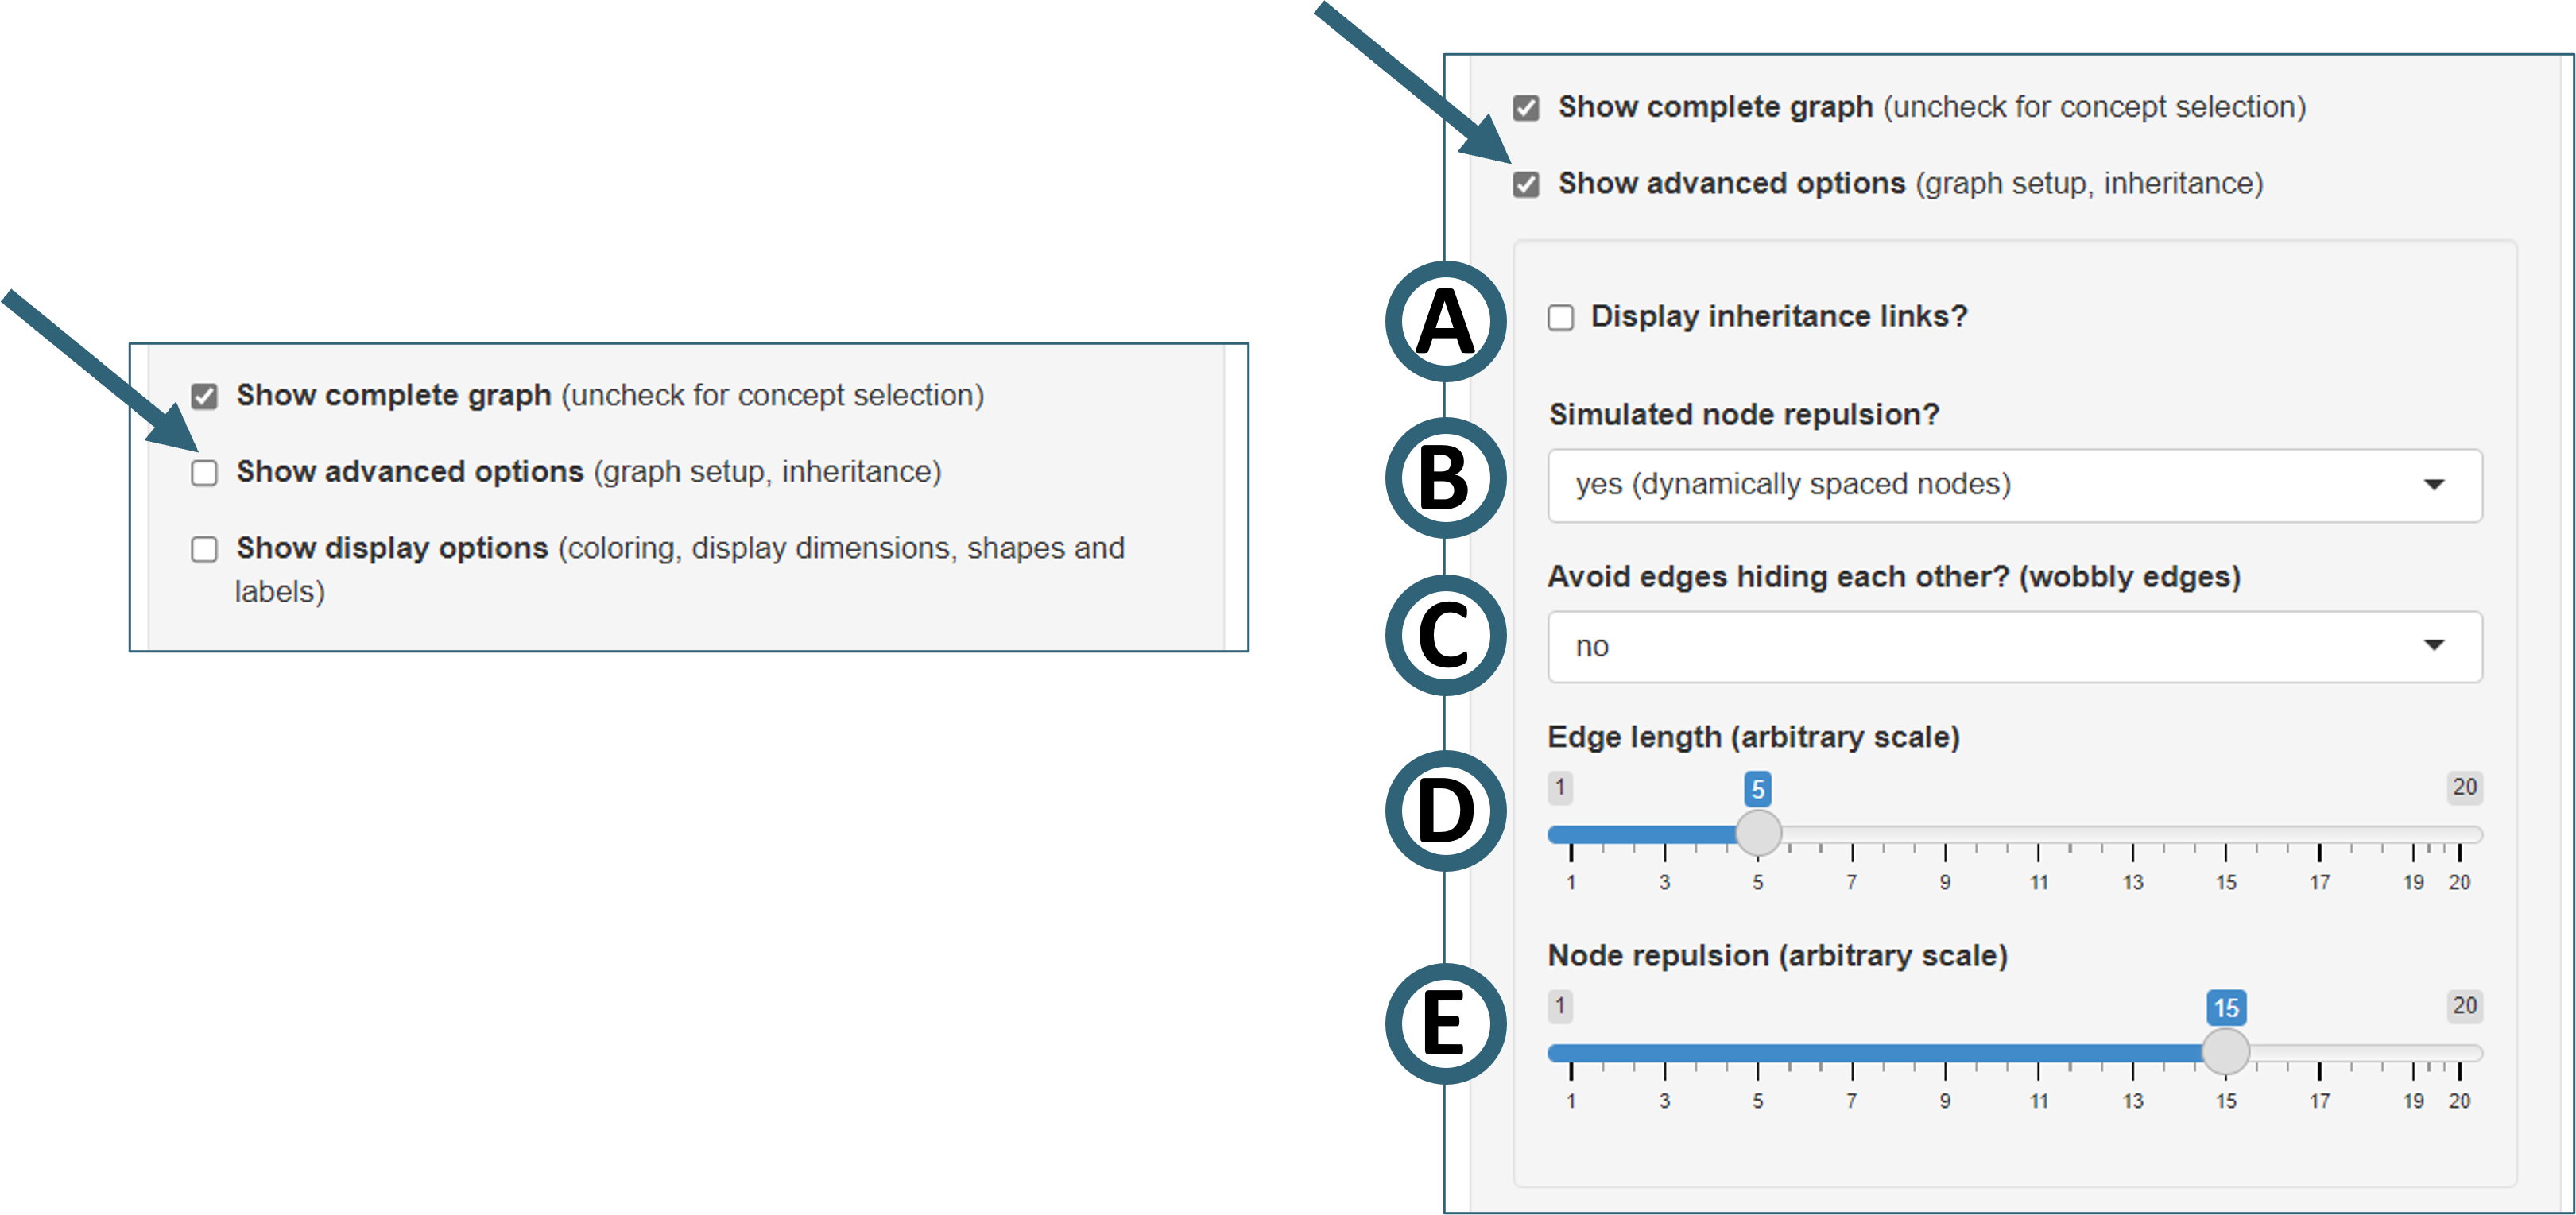
Figure 8. Selecting advanced graph options in SPHN Schema Scope.
- "Display inheritance links? (Fig. 8A)"
Option to show the links between concepts and their parents
Examples: Links from
ImplanttoMedical DeviceorReference RangetoRange
- "Simulated node repulsion? (Fig. 8B)"
Option to choose between dynamic node spacing (distance controlled by “edge length” and “node repulsion”) or static node positions
Static node positions require a manual spacing of the nodes which may be cumbersome if many nodes are displayed.
Individual nodes can be dragged with both settings. However, if node repulsion if enabled, a node may be repelled when moved too closed to another one. This results in a rearrangement of the graph.
- "Avoid edges hiding each other? (Fig. 8C)"
Edges tend to overlap when a lot of nodes are shown or multiple attributes of a concept are of the same type
Overlapping of edges can be strongly reduced with this option.
Nodes tend to be spaced far wider when this feature is enabled, adjusting node repulsion may help to compact the graph display
- "Edge length (Fig. 8D)"
Determines lengths of the connecting edges, higher values (arbitrary scale) increase the edge length
- "Node repulsion (Fig. 8E)"
Determines spacing of nodes, higher values (arbitrary scale) increase the spacing
Display options
Check the box “Show display options” to show additional options for the general graph display.
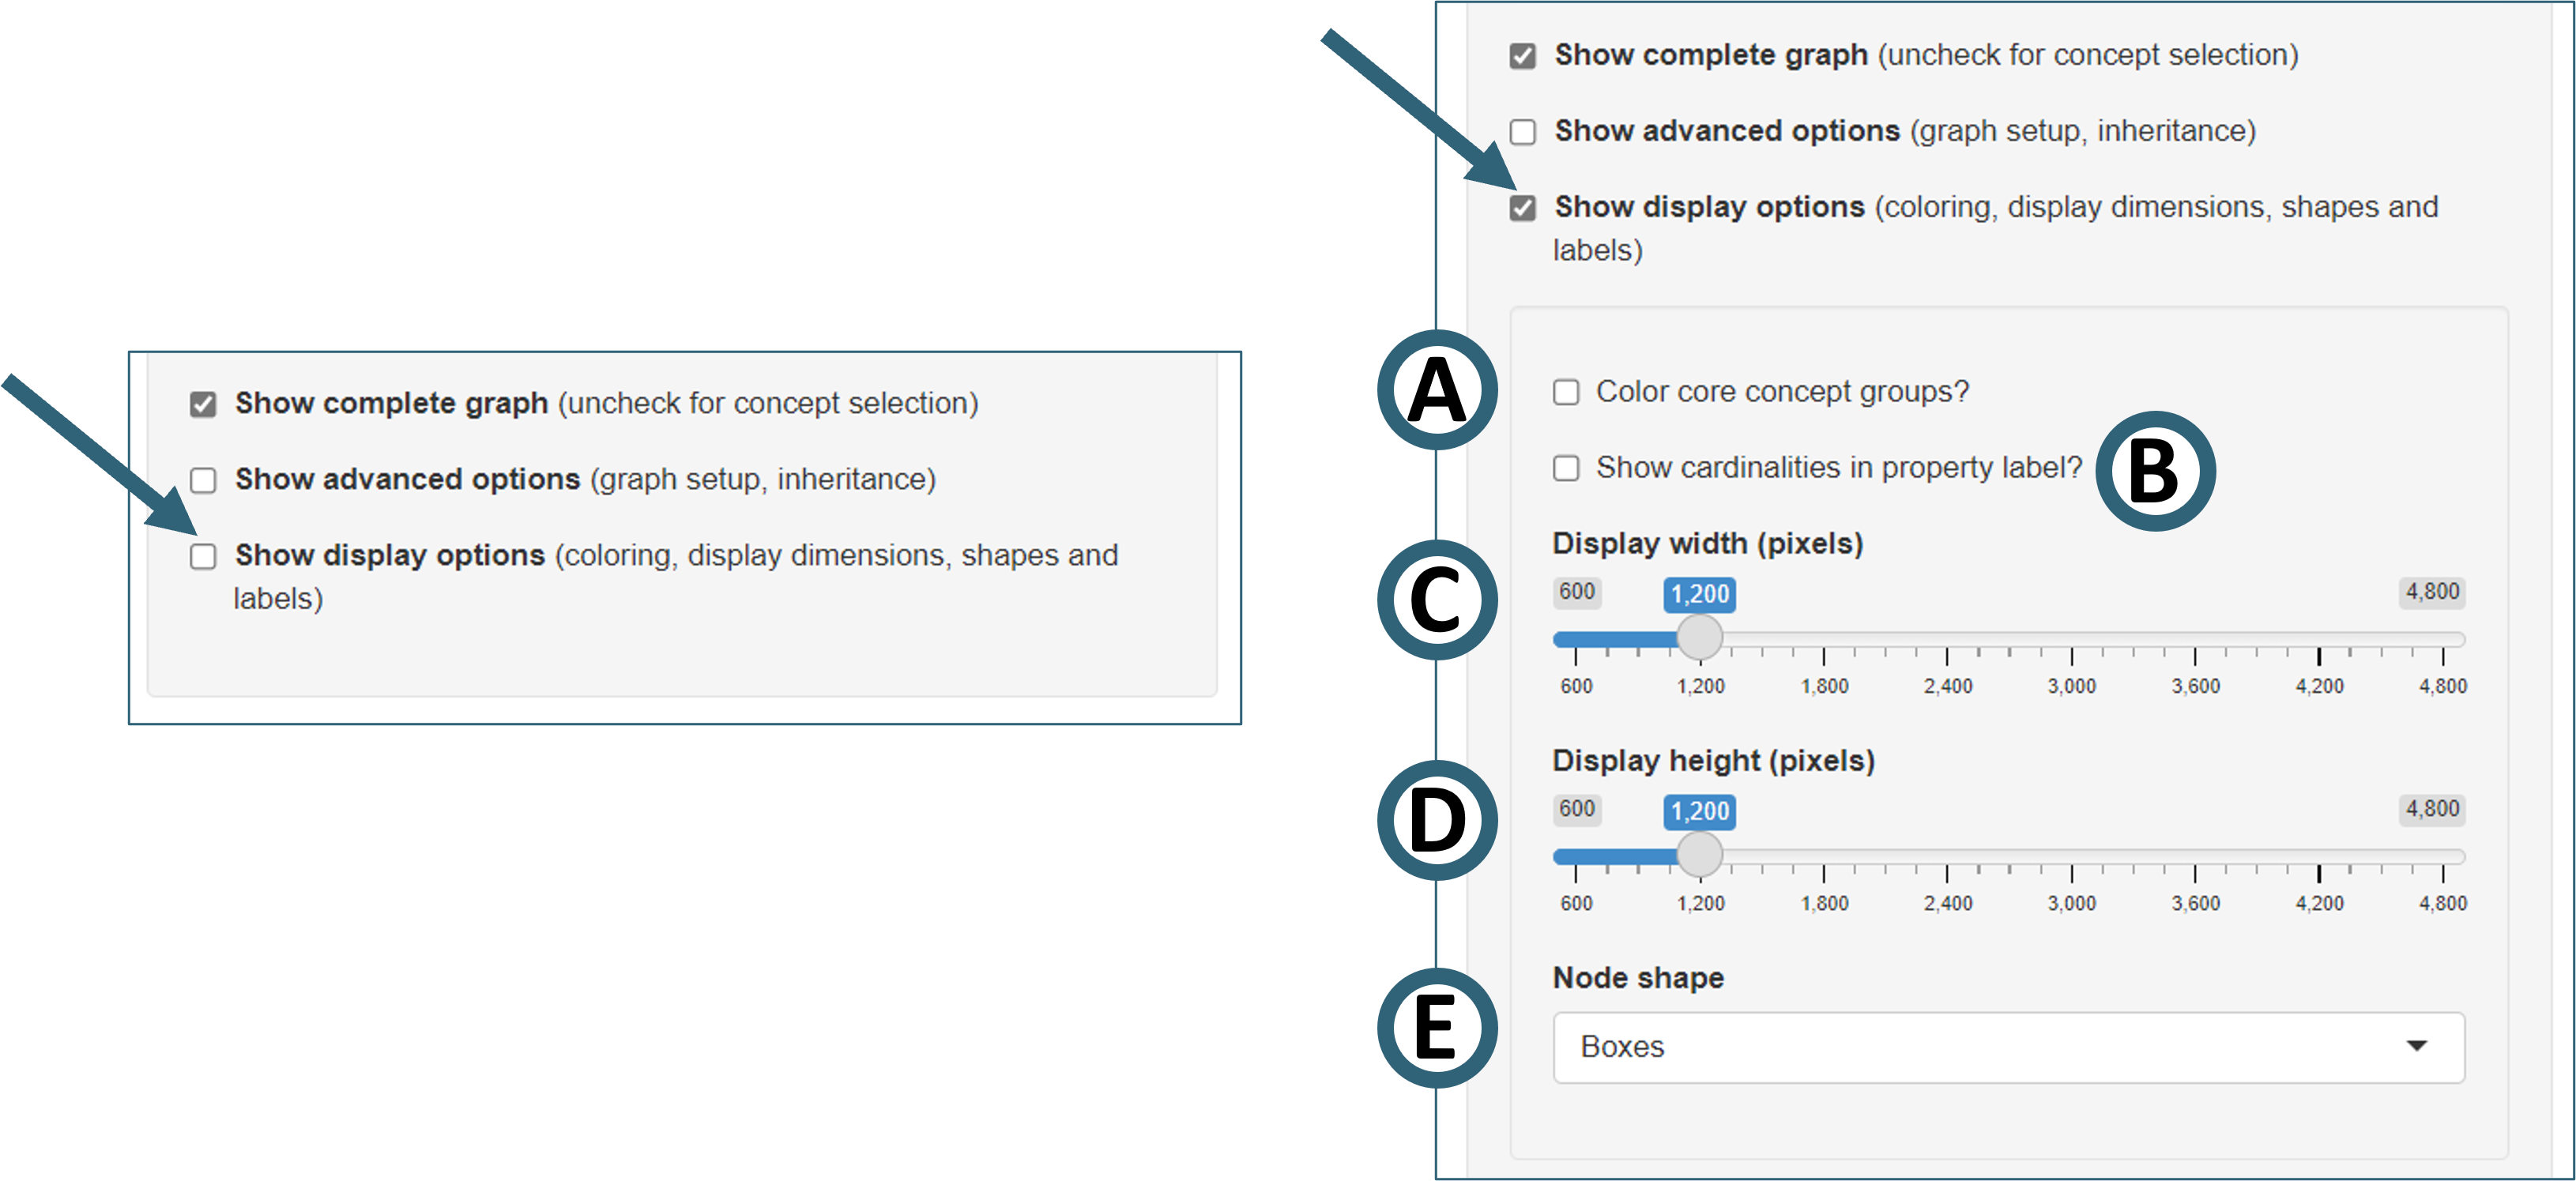
Figure 9. Selecting display options in SPHN Schema Scope.
- "Color core concept groups? (Fig. 9A)"
If enabled, nodes of several core concept families will be displayed with distinct colors
The following coloring applies:
Result(light blue),Lab Test(light orange),Assessment(light pink),Medical Procedure(green),Diagnosis(dark orange),Measurement(yellow)Examples:
AssessmentandAssessment Eventare shown in light pink,Body Weight MeasurementandHeart Rate Measurementare shown in yellow, andBody Weight,Heart RateandAssessment Resultare shown in light blue.
- "Show cardinalities in property label? (Fig. 9B)"
The cardinality of the connection of two nodes (minimum and maximum number of links) is usually displayed when hovering over en edge. If this option is selected it will be shown below the edge label instead.
- "Display width (pixels) (Fig. 9C)" and "Display height (pixels) (Fig. 9D)"
Changing the display dimensions may be beneficial on large screens or when the control sidebar is hidden (see Fig. 10 below)
- "Node shape (Fig. 9E)"
Shape of the nodes can be selected, either boxes or circles
The label is shown inside the node for boxes and below for circles.
Increasing the display canvas size
The control panel can be hidden to inrease the size of the canvas available for graph display. The switch above the graph panel (“Hide/Show control sidebar”) allows to reversibly hide the controls.
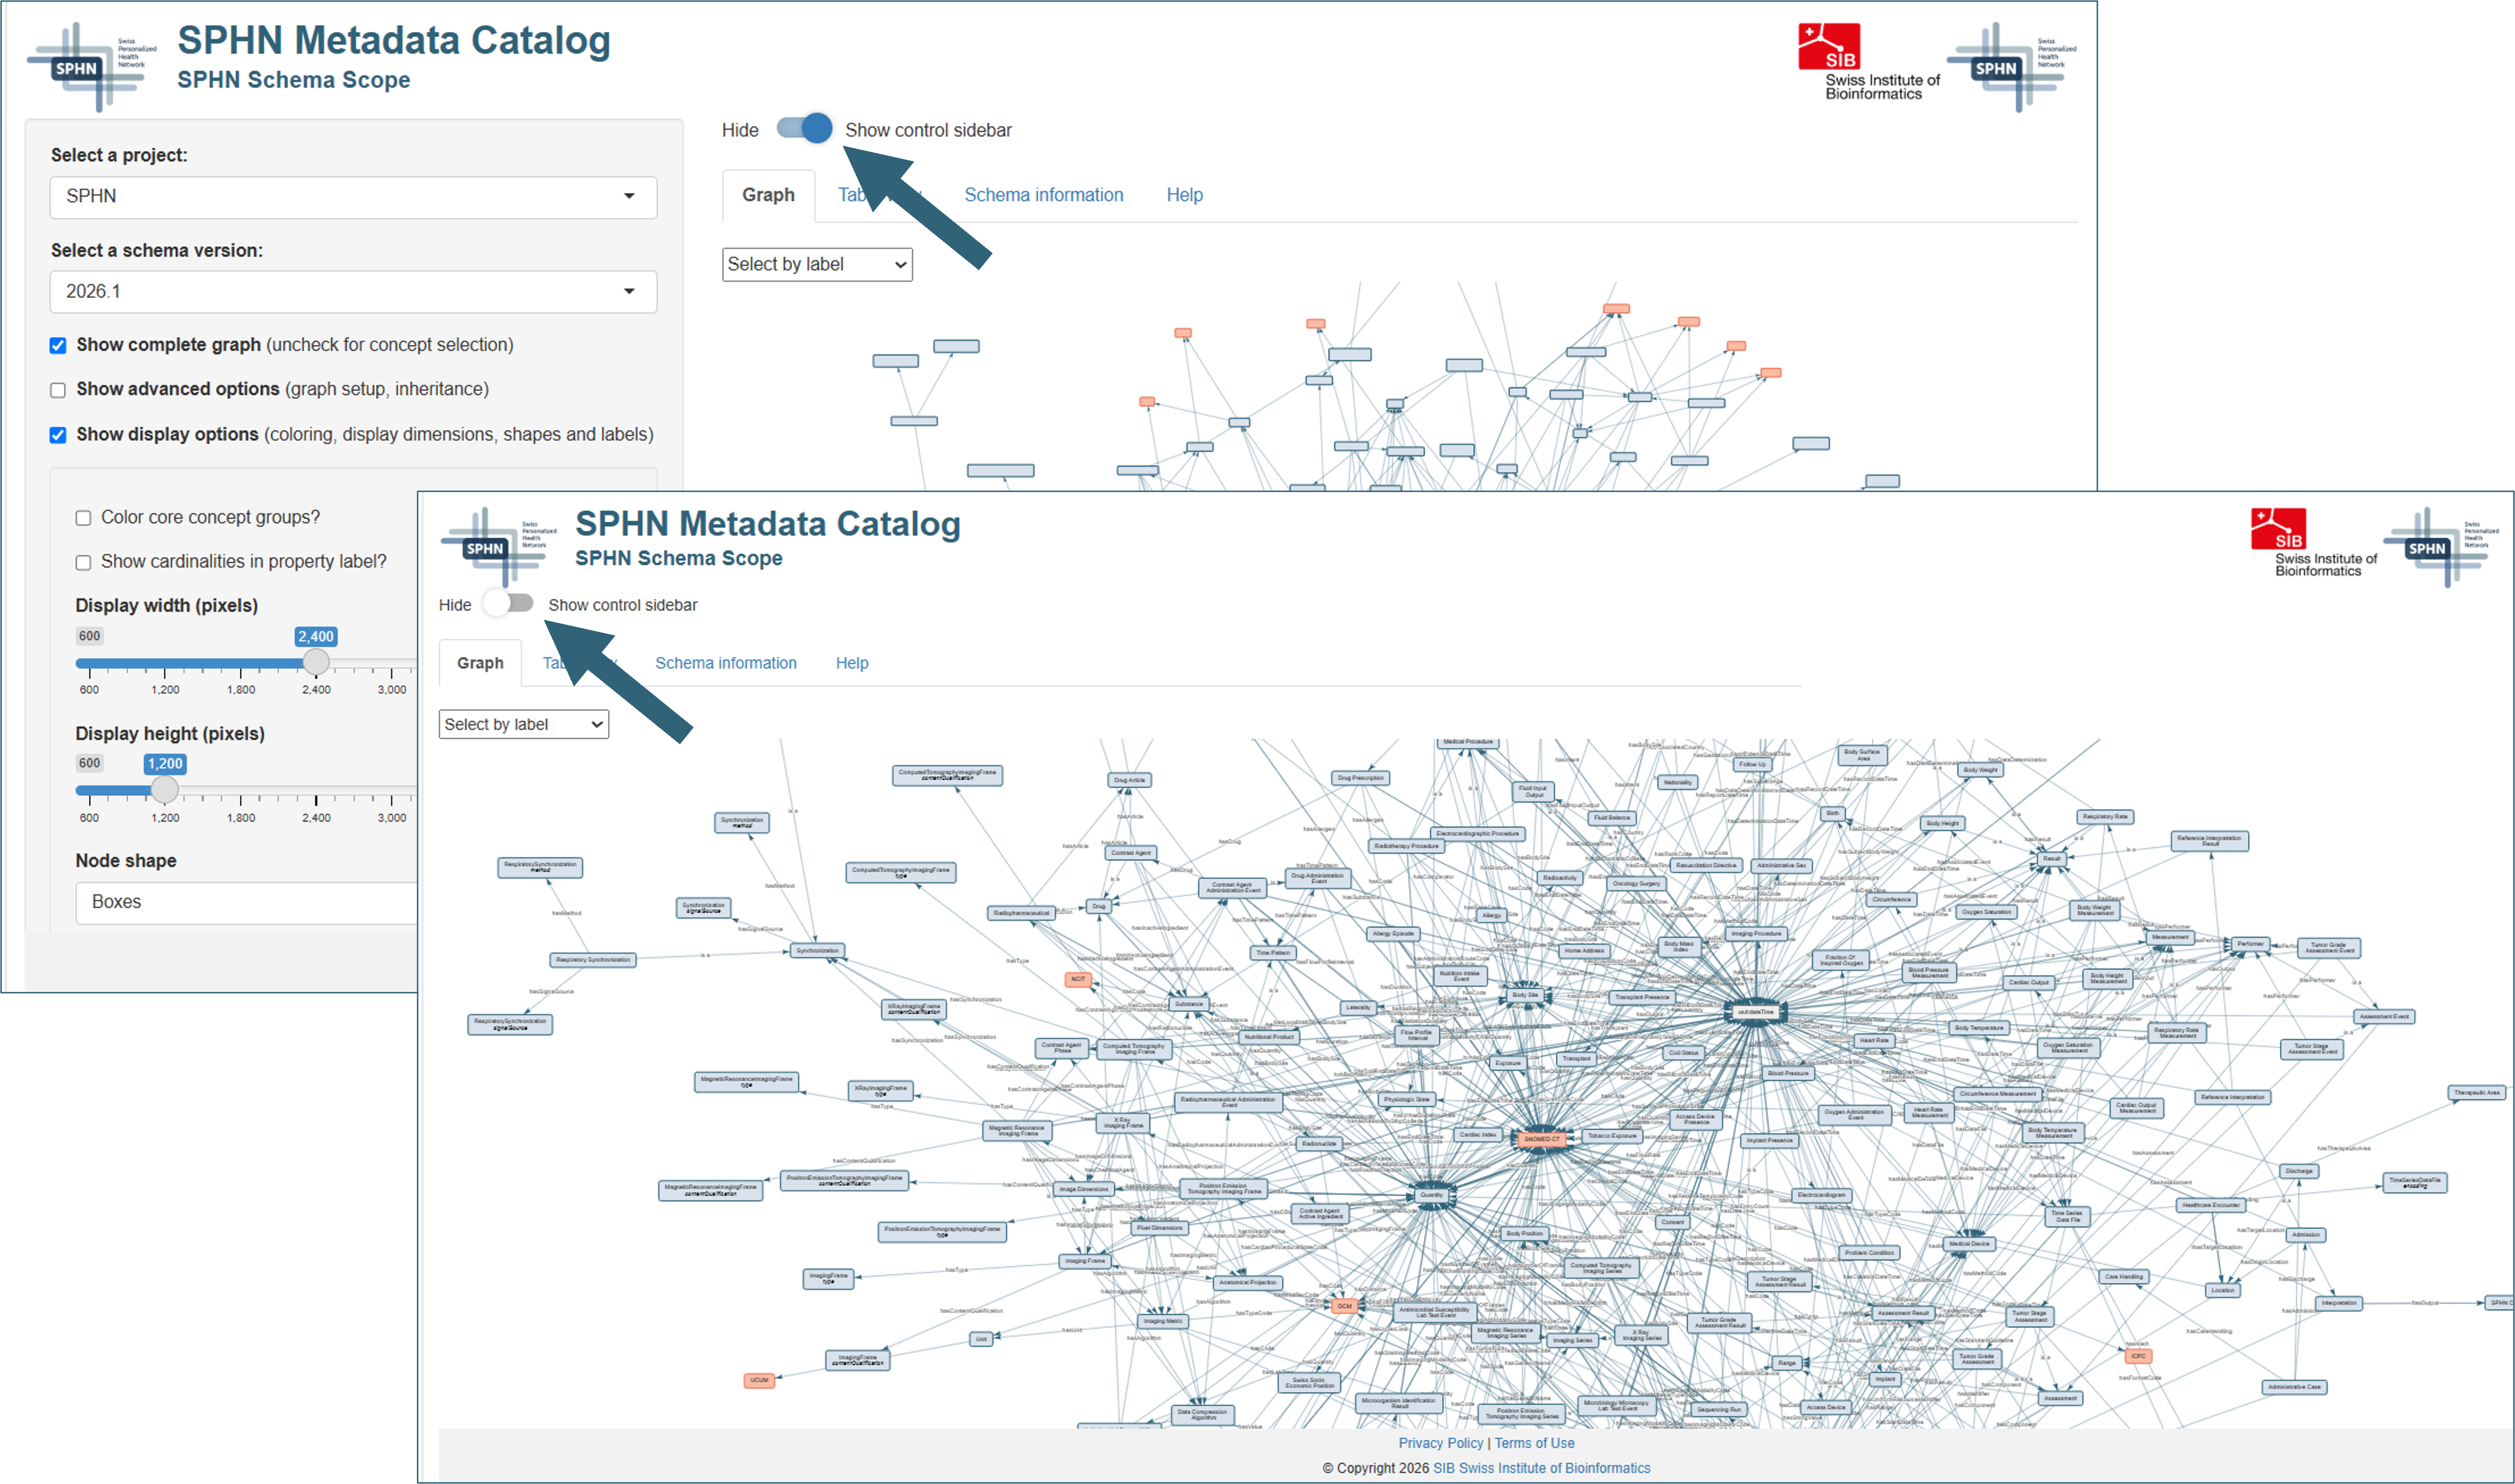
Figure 10. Toggling the display of the control sidebar
Graph and metadata display
The right part of the graphical user interface features the graph display and several additional metadata resources. This part of the display can be expanded by hiding the control sidebar (see Fig. 10 above).
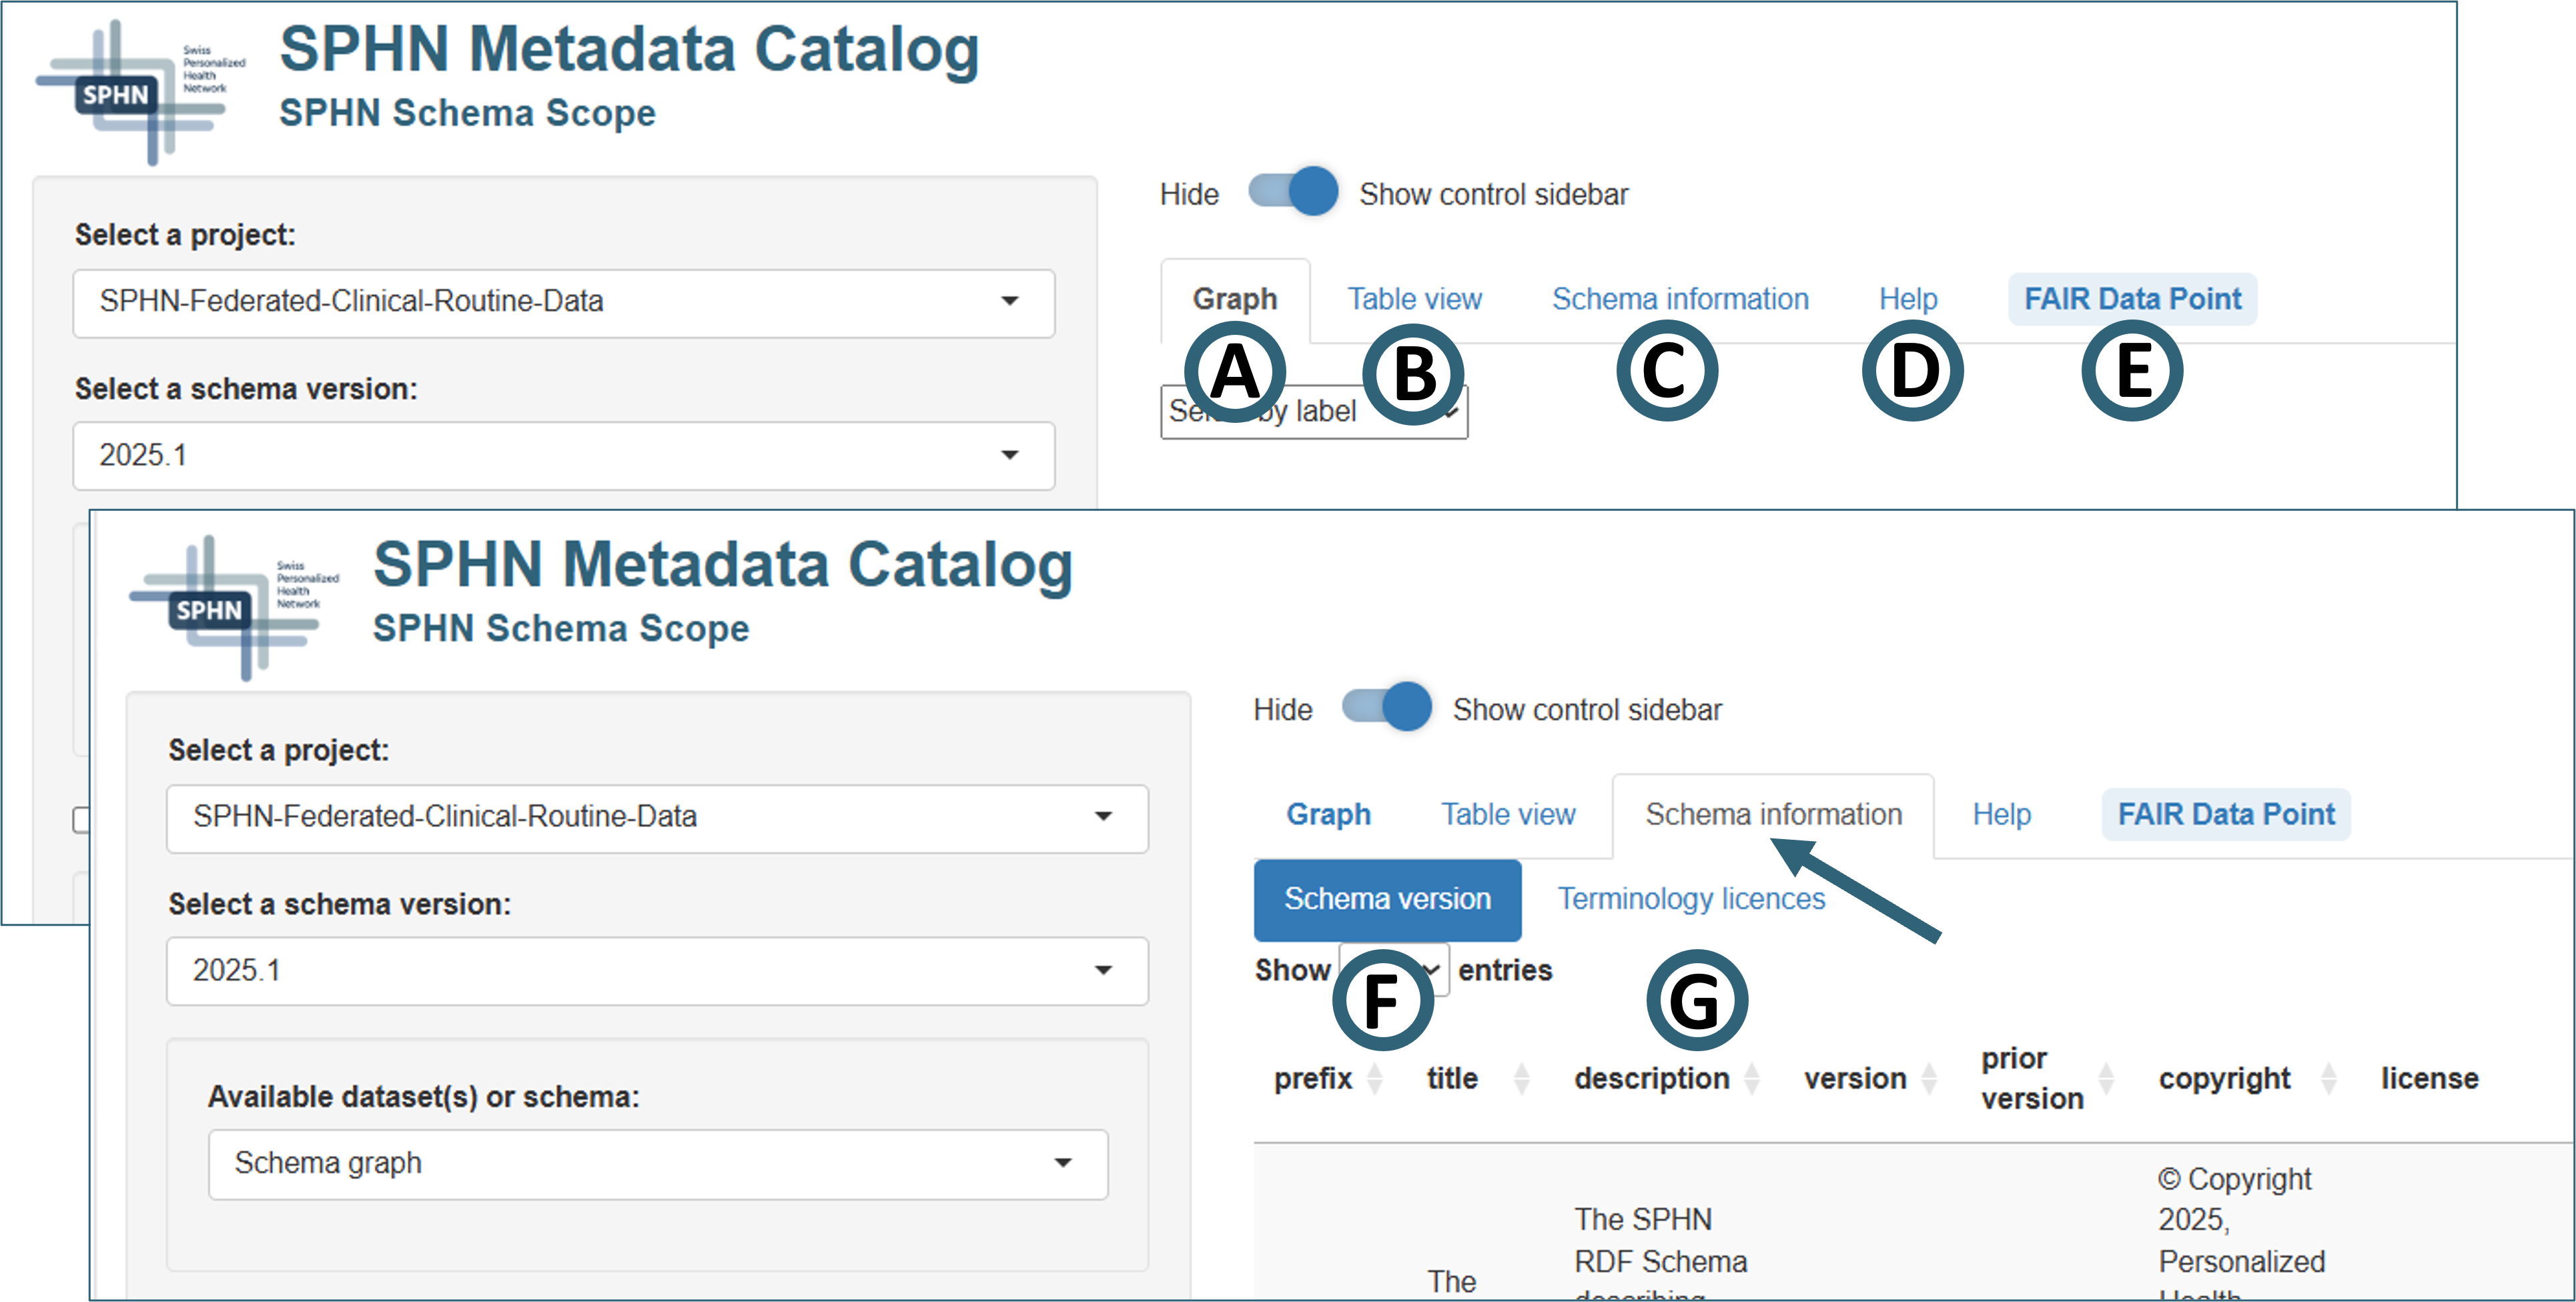
Figure 11. Overview of graph and metadata display options in SPHN Schema Scope
Graph
Table view
Schema information
Click the tab “Schema information” tab (Fig. 11C) to reveal its subtabs “Schema version” and “Terminology licenses”:
- Schema version (Fig. 11F)
Version and license information for the SPHN Schema underlying the graph
Version and license information for the project-specific schema (if applicable)
Note that the two version numbers are independent!
- Terminology licenses (Fig. 11G)
Information on the licenses of the external terminologies used by the selected schema.
A search box (upper right) allows to identify information for a specific license of interest.
Help
The “Help”-tab (Fig. 11D) features a quickstart introduction including screenshots of the key elements and a link to this extended documentation.
FAIR Data Point
A FAIR Data Point (FDP) is a REST API (Application Programming Interface built according to the design principles of the REST-architecture (Representational State Transfer)) for creating, storing, and serving FAIR metadata.
Depending on the selected project the “FAIR Data Point” tab (Fig. 11E) may become accessible next to the “Help” tab. It provides direct links for the exploration of catalog and (if applicable) dataset pages for the exploration of further metadata via the SPHN FAIR Data Point.
Availability and usage rights
© Copyright 2026, SIB Swiss Institute of Bioinformatics.
For any questions or comments, please contact the SPHN FAIR Data Team at fair-data-team@sib.swiss.
Further reading
Witte, H., Unni, D., Krauss, P., Touré, V., Armida, J., Österle, S. (2026). The Swiss Personalized Health Network Metadata Catalog: Platform for Health Data Discovery and Exploration Based on Findable, Accessible, Interoperable, and Reusable Principles. JMIR Med Inform 2026; 14:e90146. (https://medinform.jmir.org/2026/1/e90146; doi:10.2196/90146)